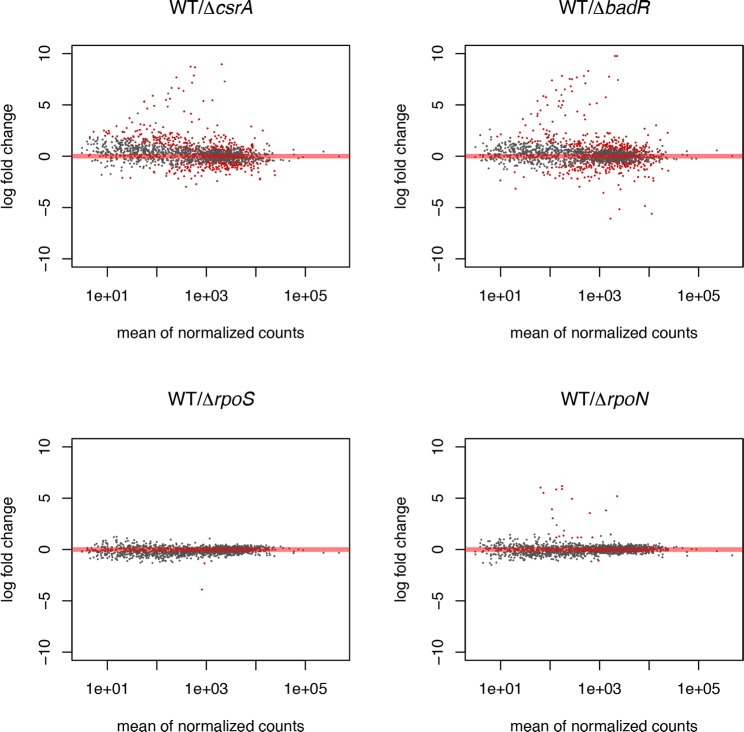
Fig 1. Log ratios of samples vs. mean abundance of transcripts.
(A) csrA mutant compared to wild-type. (B) badR mutant compared to wild-type. (C) rpoS mutant compared to wild-type. (D) rpoN mutant compared to wild-type. Red points indicate transcripts which met the criteria of a log2 fold change >1 and an adjusted p-value (padj) < 0.05. The X-axis is given as mean normalized count across compared samples and the Y-axis as log2 fold change between conditions.

