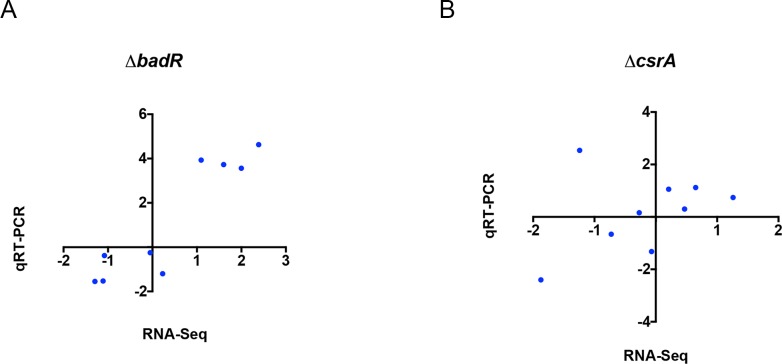
Fig 2. qRT-PCR of select transcripts in csrA and badR mutants.
Total RNAs from the cultures used for RNA-Seq were converted to cDNA. qRT-PCR was performed on cdaA, bosR, glpF, glpK, glpD, spoVG, bbk32, dbpA, and sodA. Pearson correlations were calculated and plots were generated using GraphPad Prism 6. (A) Scatter plot comparing fold-change of each transcript as assayed by qRT-PCR (Y-axis) and RNA-Seq (X-axis) for ΔbadR compared to the wild-type parent. The assayed transcripts were highly correlated, with a Pearson coefficient of 0.921, and two-tailed P-value of 0.0004. (B) Scatter plot comparing fold-change of each transcript as assayed by qRT-PCR (Y-axis) and RNA-Seq (X-axis) for ΔcsrA compared to WT. The analyzed transcripts were not correlated, due to a single outlier, sodA, with a Pearson coefficient of 0.364. Also due to the outlier, the two-tailed P-value is 0.336. The reason for the sole inconsistency of sodA in ΔcsrA is unclear. Ongoing investigations of sodA indicate that it is under complex regulation, including apparent post-transcriptional control by the BpuR RNA-binding protein (our unpublished results).

