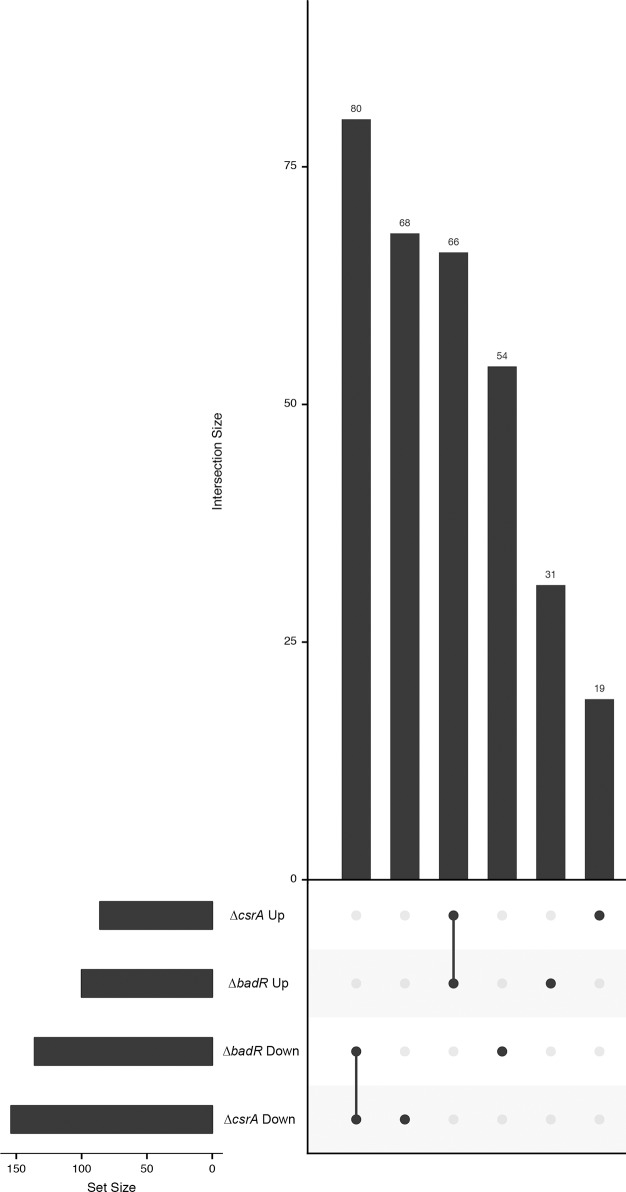
Fig 6. Set analysis of differentially expressed gene sets.
The differentially expressed transcripts from either the csrA or badR mutant vs. wild-type parent were compared for any overlap in identity using the UpsetR package. Affected transcript sets were first filtered by higher or lower abundance to create 8 possible sets (Four regulators, at higher or lower abundance). The horizontal bars on the lower left side indicate the number of transcripts in each set (e.g. 153 transcripts were significantly reduced in the csrA mutant). Dark dots indicate each set, and dark dots connected by a line indicate paired sets (e.g. the leftmost dots and line refer to the paired set of transcripts that were reduced in both the csrA and badR mutants). The vertical bars indicate the number of transcripts in each set or paired set (e.g. 80 transcripts were reduced in both the csrA and badR mutants, 68 transcripts were reduced only in the badR mutant, 66 transcripts were elevated in both the csrA and badR mutants, etc.).

