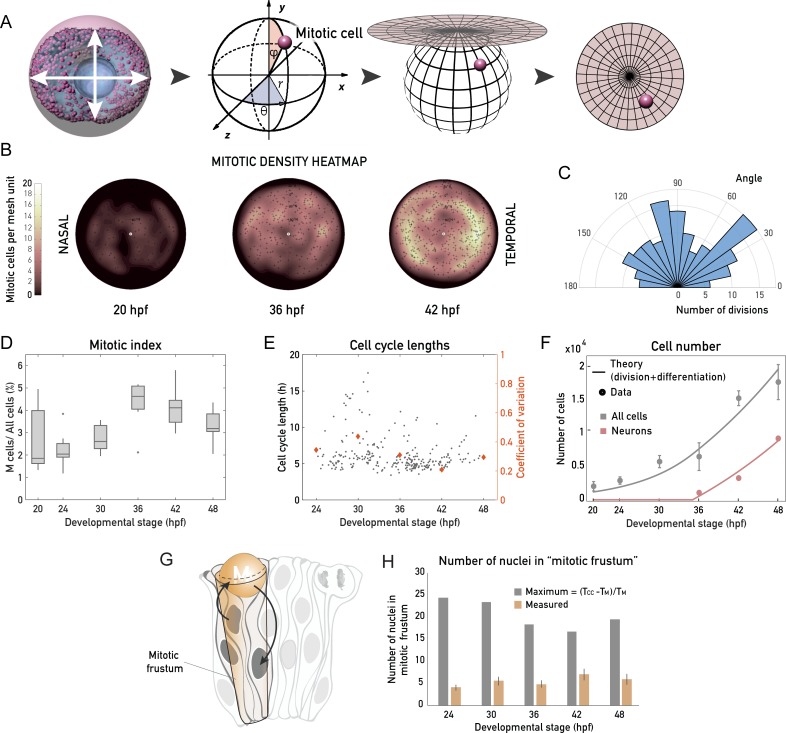
Fig 3. Retinal PSE growth is not strongly oriented, is homogeneous, and is unconstrained by the apical surface area.
(A) Schematic of the mitotic distribution workflow to generate 2D mitotic density heatmaps; 3D Cartesian coordinates of every mitotic cell (see Materials and methods) were transformed into polar, spherical coordinates, which were then projected into 2 dimensions using a density-preserving azimuthal projection tool. (B) Typical 2D heatmaps of mitotic densities at 20 hpf, 36 hpf, and 42 hpf, obtained by transformations in (A). N = 10 samples/stage. (C) Rose plot of division angles, analyzed from samples 24–42 hpf. N = 15 embryos. Related to S2 Movie. (D) The mitotic index through development, calculated as the fraction of mitotic cells of all retinal PSE cells in a 3D tissue-wide retinal sample. (E) Cell cycle lengths of progenitor retinal PSE cells, analyzed by manual tracking of 254 cells from 20 embryos. Related to S3 Movie. The developmental stage on the x-axis is the middle point of the cell cycle, in hpf. Times on the x-axis are the CoVs for each stage plotted as orange diamonds (right y-axis). Data for CoV were binned as stage ± 3 h. (F) Total number of cells in the retina (gray points, as in Fig 1D) and number of committed progenitors/neurons (pink points) from data in S2 Fig. Gray and pink lines: theoretical cell and theoretical neuron number, assuming a constant rate of division and a 35% probability of dividing progenitors to produce 2 committed progenitors/neurons after 35 hpf (see S1 Text). Data points are plotted as mean ± SD. (G) Schematic representation of PSE tissue architecture, with apical mitoses (see also S3 Fig), migrating nuclei (arrows), and the mitotic frustum. The mitotic frustum is depicted as a truncated conical unit below the rounded mitotic cell. (H) Number of cells under the rounded mitotic cell. Measured values are calculated from tissue-wide nuclear density and mitotic frustum volume in each developmental stage (N = 10 samples/stage, see Materials and methods). Maximal possible number of cells is calculated as the time during which nuclei are absent from the apical surface (TCC − TM), divided by TM in each stage (see Materials and methods). (Underlying data can be found at DOI: 10.5281/zenodo.1316912; for panel B at /Matejcic-et-al_2018/Tools/MitoticDistribution/Positions_data/, for panel D at /Matejcic-et-al_2018/Data/F1_2_3D_S12BD34.csv, for panel E at /Matejcic-et-al_2018/Data/F3E.csv, panel H at /Matejcic-et-al_2018/Data/F3H.csv and F3H_4A.csv. The theoretical analysis for panel F can be found at /Matejcic-et-al_2018/Theory/Data analysis_essentials.nb.). CoV, coefficient of variation; hpf, hours post fertilization; PSE, pseudostratified epithelium; TCC, total cell cycle time; TM, duration of mitosis.

