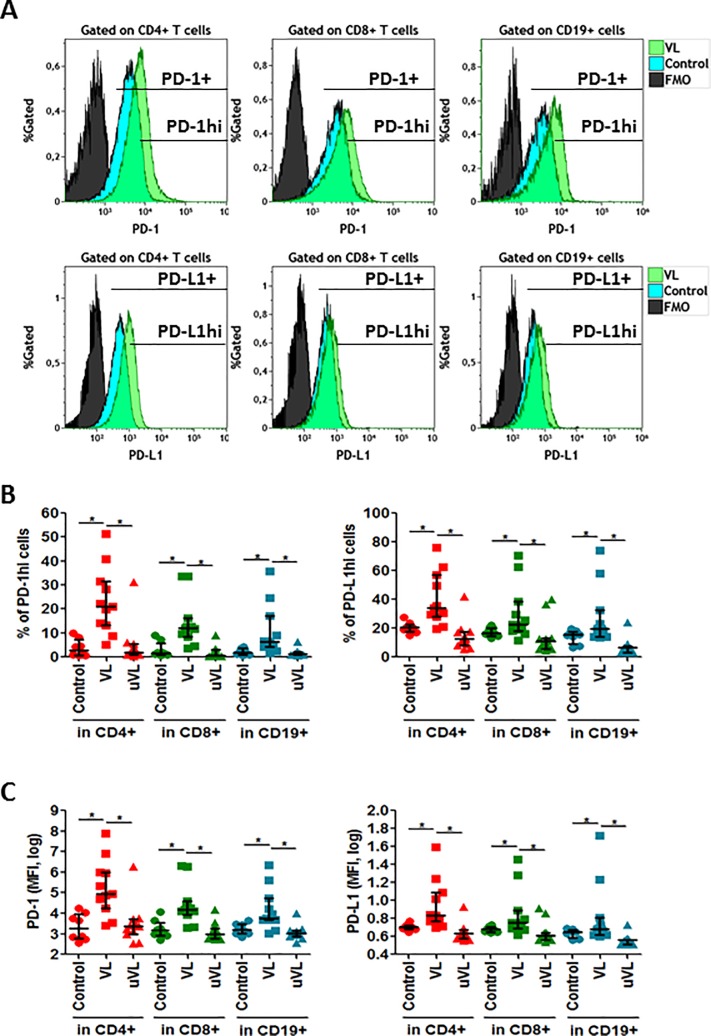
Fig 1. PD-1 and PD-L1 expression.
Whole blood was labeled to determine PD-1 and PD-L1 subsets. (A) Histogram plots representatives of one healthy individual and one VL-HIV-1+ individual. PD-L1+ and PD-L1hi were determined in CD4+, in CD8+ and CD19+ cells. (B) Frequencies of PD-1hi or PD-L1hi in CD4+, CD8+ T and CD19+ cells and (C) MFI (median fluorescence intensity) of PD-1 and PD-L1 expression in CD4+, CD8+ T and CD19+ cells. Median [Q1-Q3]; represented. * = p<0.05 when comparing conditions. Each symbol corresponds to an individual.

