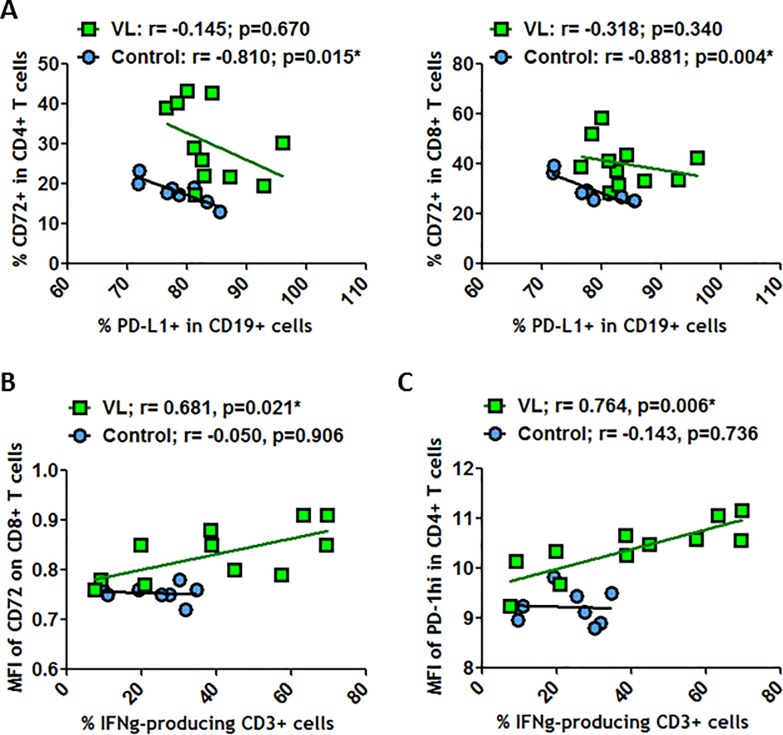
Fig 6. Correlations between PD-L1+ on CD19+ cells and CD72+ on T cells.
(A) Correlations between frequencies of PD-L1 on CD19+ cells and frequencies of CD72 on CD4+ T cells and on CD8+ T cells. (B) Correlations between frequencies of IFN-γ-producing CD3+ T cells and MFI of CD72 on CD8+ T cells. (C) Correlations between frequencies of IFN-γ-producing CD3+ T cells and MFI of PD-1hi on CD4+ T cells. All these correlations were determined in healthy individuals and in VL-HIV-1+ individuals. Correlations were determined by Spearman’s rank correlation. * = p<0.05 when comparing conditions. Each symbol corresponds to an individual.

