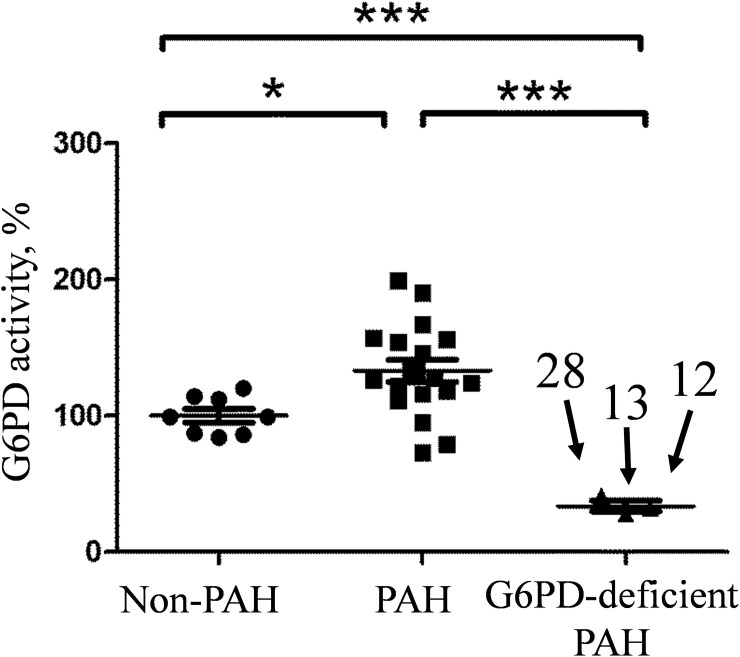
Fig 1. G6PD activity in RBC pellets.
Activity is normalized to protein concentration and presented in relation to the non-PAH group mean. Measurements are done in duplicates and the average of two for each sample is plotted. Three samples with the lowest G6PD activity form a separate group. Unpaired t-test is used for pairwise comparison of groups. *p = 0.015, *** p = 0.0001.

