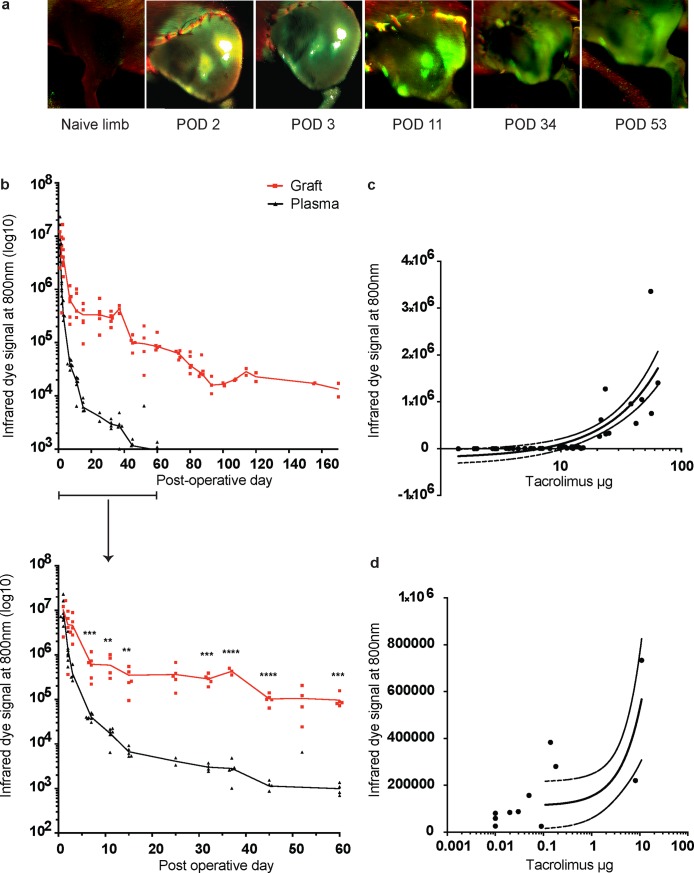
Fig 5. Near-infrared dye release from TGMS-TAC in a Brown Norway-to-Lewis rat hind limb transplantation model.
a) Representative images of longitudinal monitoring of fluorescence emission at 800 nm from grafted limbs treated with NIRD-containing TGMS-TAC (n = 5). POD–Post-operative day; green–emission of NIRD at 800 nm; red–auto fluorescence of tissue, hair and sutures at 700 nm; white–overexposure. b) Longitudinal monitoring of fluorescence emission at 800 nm from grafted limbs and plasma (n = 5). Values are normalized for area, overexposed areas were excluded, and background subtraction was performed by imaging limbs and plasma before transplantation, and subtracting the mean obtained values. Featured is a close-up of the first 60 days, including analyses (** p < 0.01; *** p < 0.001; and **** p < 0.0001; multiple t-test with Holm-Sidak correction, p values are indicated directly above the corresponding time points). c) and d) Pearson correlation of tacrolimus and NIRD release from TGMS-TAC in plasma (c) and graft skin (d)–linear regression with 95% confidence intervals.

