
Fig 2. Scatter plot and correlation matrix among blood mercury, work duration, T3, T4 and TSH among study participants.
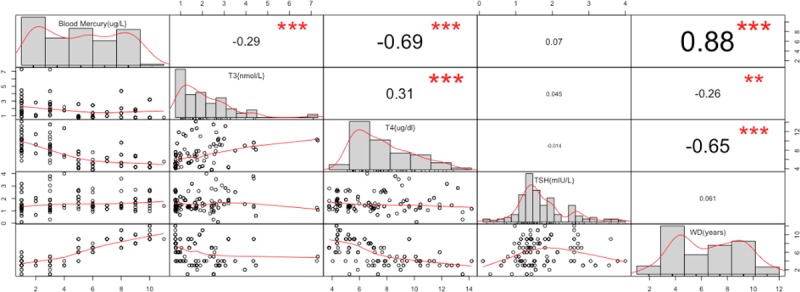
** indicates significant correlation numbers show the correlation coefficient.
Official websites use .gov
A
.gov website belongs to an official
government organization in the United States.
Secure .gov websites use HTTPS
A lock (
) or https:// means you've safely
connected to the .gov website. Share sensitive
information only on official, secure websites.
** indicates significant correlation numbers show the correlation coefficient.