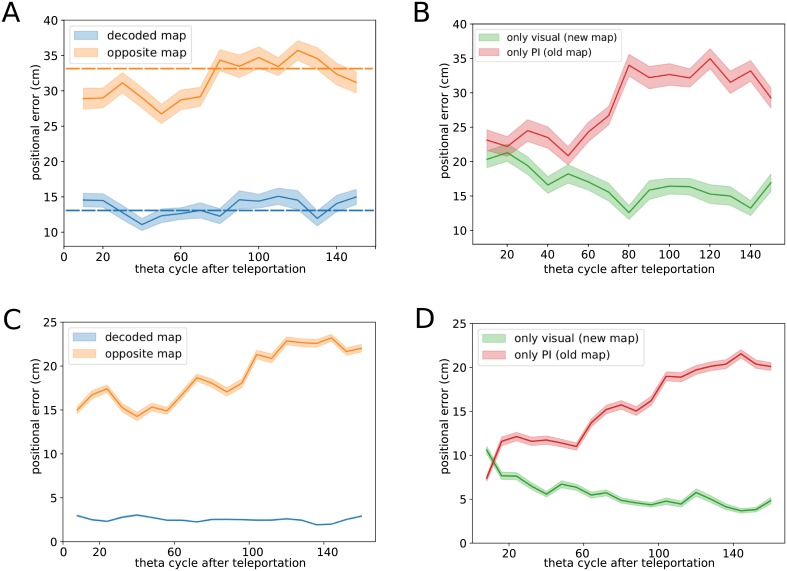
Fig 3. Positional error as a function of time from the teleportation light switch.
A. Recorded data. Positional error computed as a function of time from the teleportation (in units of theta cycle). In each theta bin t, the map decoder is used to select which map mt (set of place fields) to use to infer the position from the neural activity (Fig 1A). When using the decoded map mt, the positional error (blue line) is comparable to the one found in constant-environment conditions (blue dashed line). The orange line shows the positional error if the opposite map (alternative to mt) is used for inferring position. The positional error is significantly reduced with respect to constant-environment conditions (orange dashed line) in the vicinity of the teleportation, and reaches comparable values after ∼ 80 theta bins. Shaded areas represent the standard error computed over 15 teleportation events. B. Recorded data. Same as in panel A but using a fixed map of reference for position inference, irrespectively from the decoded map. Red and green lines show results with, respectively, the ‘old’ (pre-teleportation) and the ‘new’ (post-teleportation) maps. C & D. Simulations of CANN model: same analysis as in panels A & B, computed over 15 simulated teleportation events, with the same trajectory of the rodent as in the experimental data. Model parameters: N = 400 neurons, γJ = 0.0025, γV = γPI = 0.4, γW = 6.25, β = 15, see Methods and Figs. B&C in S1 Text for detailed discussion of the choice of parameters.

