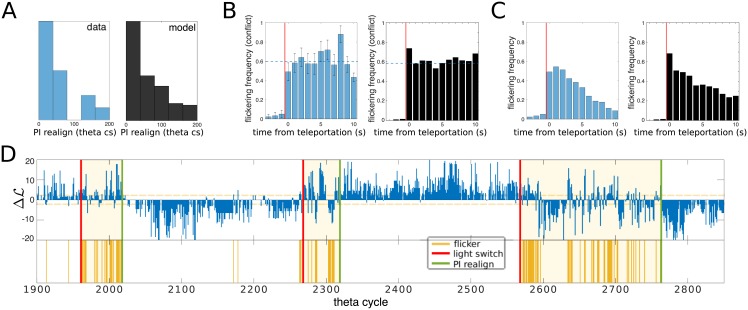
Fig 5. Flickering rate is homogenous within each conflicting period.
A. Distribution of the path-integrator realignment times in a simulated session (right) and inferred from the recorded data (left). B. Mean Frequency of Flickers (MFF) during the conflicting phase, binned over 8 theta bins (∼ 1 second) intervals. MFF is constant during the conflicting phase, both in the model (right) and in recordings (left). Realignment times inferred from data were obtained with a Bayesian procedure (Methods); histograms show flickering frequency in each time bin t normalized with respect to the fraction of conflicting phases, out of 15 teleportation events, that survived at least up to time t. C. Convolution of the two distributions shown in panels A and B, i.e. the MFF computed on the full test session, shows an apparent exponential decay both in the model (right) and in data (left, similar to the analysis shown in [27]). D. Map decoder output and inferred PI-realignment times for the experimental test session; 3 out of 15 teleportations are shown. Light switches are marked with red lines, inferred PI-realignment times are marked with green lines. Identified conflicting periods are shaded. Simulated data were obtained with the same model parameters as in Fig 3.

