
Figure 5.
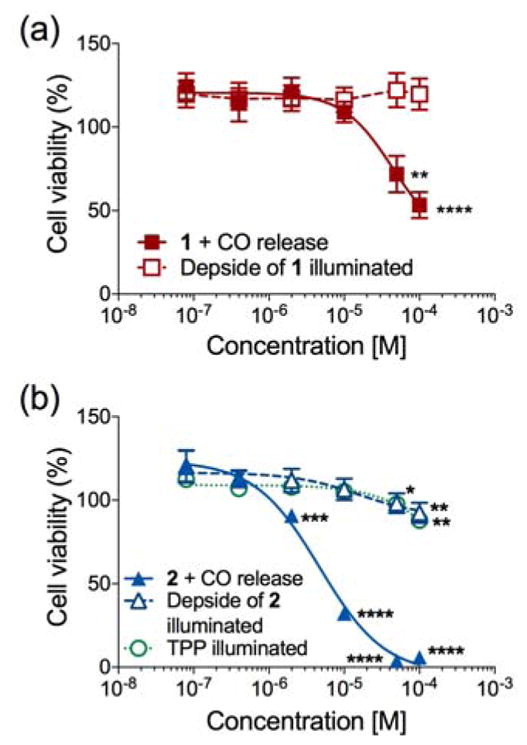
Plots of percent cell viability in A549 cells for 1 (a), or 2 (b), their photo-induced reaction products, and 2-carboxyethyl-triphenylphosphonium bromide upon illumination in cells.
Official websites use .gov
A
.gov website belongs to an official
government organization in the United States.
Secure .gov websites use HTTPS
A lock (
) or https:// means you've safely
connected to the .gov website. Share sensitive
information only on official, secure websites.
Plots of percent cell viability in A549 cells for 1 (a), or 2 (b), their photo-induced reaction products, and 2-carboxyethyl-triphenylphosphonium bromide upon illumination in cells.