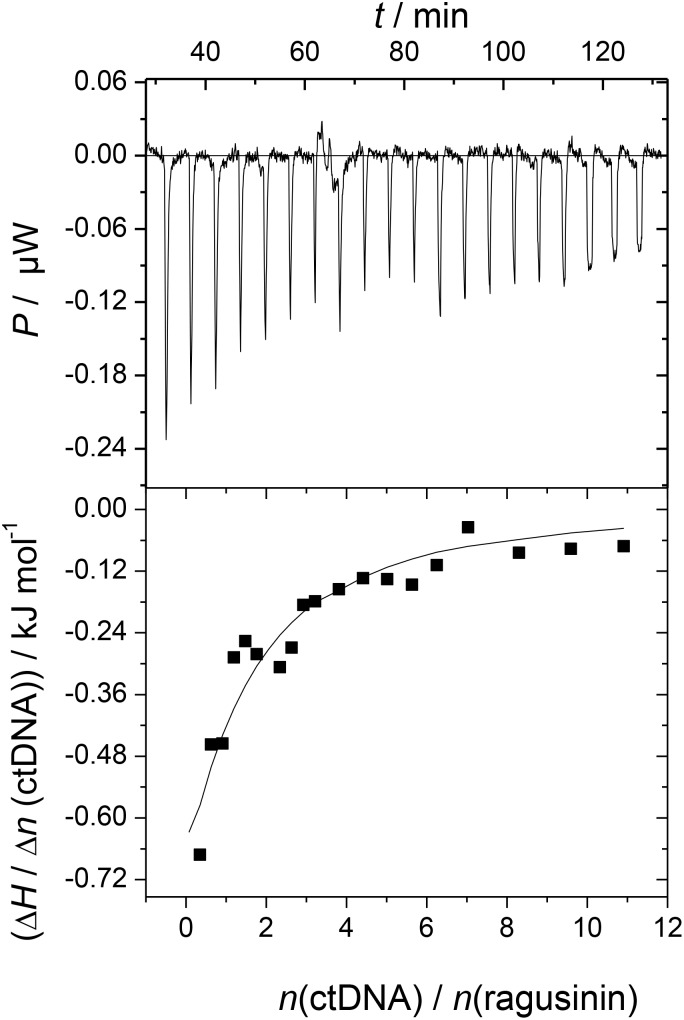
FIGURE 3.
Calorimetric titration of compound 5 (c = 3 × 10⁻⁵ mol dm-3) with ctDNA (c = 1.5 × 10⁻³ mol dm-3) in sodium cacodylate buffer (pH 7.0, I = 0.05 mol dm-3; T = 25°C; ΔrG/kJ mol-1 = -23.0). The top panels represent the raw data from the single injection of ctDNA into a solution of 5 and the bottom panels show the experimental injection heats while the solid lines represent the calculated fit of the data.

