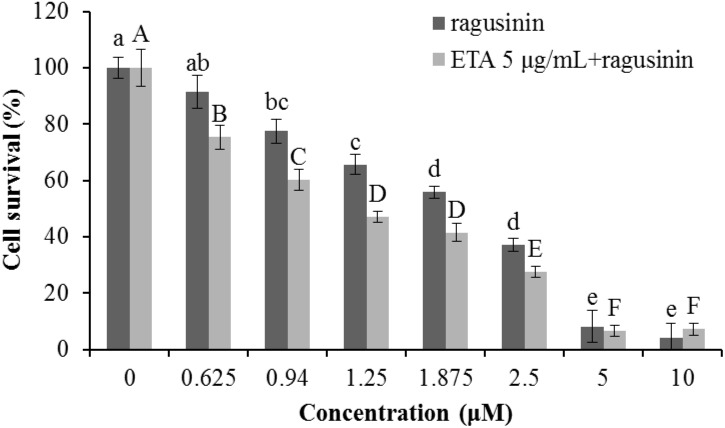
FIGURE 9.
The treatment of HeLa cells with ethacrynic acid (ETA). The cells were pre-treated with 5 μg/mL ETA. Two hours later the cells were treated with different concentrations of 5. 72 h later an MTT assay was performed. Bars represent the mean of quadruplicates ± SD. Different letters indicate significant difference at p < 0.05. All experiments were performed at least three times.

