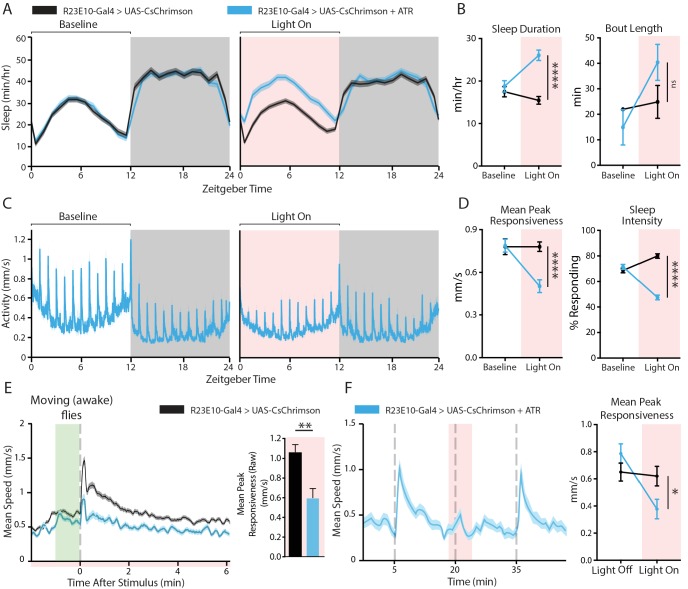
Figure 2. Behavioral effects of acutely activating R23E10 neurons.
(A–D) Effects on sleep and responsiveness following the activation of R23E10 neurons (blue, UAS-CsChrimson/+;R23E10-Gal4/+ with ATR, n = 102) compared to those in control flies (black, no ATR feeding, n = 118). Error bars and shading indicate standard errors of the mean (SEMs) and asterisks indicate significance (****p<0.0001, ns = not significant, t-tests). (A) Mean sleep duration (min/hr) during the period 24 hr before red light activation (left), then during the next 24 hr when red light is delivered for 12 hr during the day (pink shading, right). (B) Comparison of the 12-hr day period without red light (baseline) to the period of red-light activation in terms of sleep duration and bout length. (C) Mean activity (mm/s) for R23E10 activation for the time periods in (A). Spikes in activity show timing of hourly vibration stimuli. (D) Comparison between the 12-hr day period without red light (baseline) and the period of red-light activation for peak responsiveness and sleep intensity. (E) Left, average stimulus response for UAS-CsChrimson/+;R23E10-Gal4/+ with ATR (blue, n = 50) compared to control flies (black, no ATR feeding, n = 48) during red-light activation (Figure 2A–D red shading) in flies that moved in the minute prior to the stimulus (i.e. awake flies). Right, summary histogram (average ± SEM). **p<0.01, t-test. (F) Example activity trace of flies responding to stimuli 15 min apart (gray dashed lines): 1 min CsChrimson activation (red shading) prior to the stimulus is alternated with trials without red light (left panel). One minute of dFB activation is sufficient to decrease responsiveness (right panel, UAS-CsChrimson/+;R23E10-Gal4/+ with ATR n = 83, control n = 80, *p<0.05, t-test). See also Figure 2—figure supplements 1, 2 and 3.


