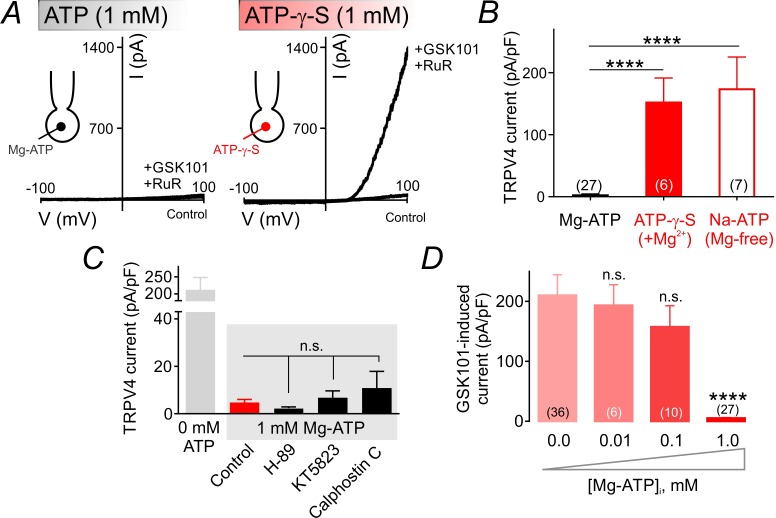
Figure 2. ATP hydrolysis is required for ATP-mediated suppression of TRPV4 channel activity.
(A) Representative traces of current-voltage relationships in cECs recorded using voltage ramps (−100 to 100 mV) before and after the application of 100 nM GSK101 and 1 µM RuR. cECs were dialyzed with 1 mM Mg-ATP (left) or 1 mM Mg-ATP-γ-S (right). (B) Summary data showing GSK101 (100 nM)-induced outward currents at 100 mV in cECs dialyzed with Mg-ATP (1 mM), Mg-ATP-γ-S (1 mM) or Na-ATP (1 mM, in Mg2+ free solution). A minimum duration of 5 min after the application of GSK101 was allowed for outward TRPV4 current to develop in each cEC. Data are presented as means ± SEM (****p<0.0001 vs. Mg-ATP, one-way ANOVA followed by Dunnett’s multiple comparisons test). (C) TRPV4 outward currents induced by 100 nM GSK101 at 100 mV, recorded from dialyzed cECs (0 and 1 mM Mg-ATP). Mg-ATP–dialyzed cECs (gray shadow) were pre-treated with inhibitors of PKA (H-89, 1 µM), PKG (KT5823, 1 µM) or PKC (calphostin C, 0.5 µM) for ~10–15 min prior to GSK101 application, or left untreated (control). Data are presented as means ± SEM (n.s. denotes not significant vs. control Mg-ATP, one-way ANOVA, Dunnett’s multiple comparisons test, n = 6–24). (D) Summary data showing the effect of raising intracellular Mg-ATP concentration on GSK101-induced TRPV4 currents. Data are means ± SEM (****p<0.0001, one-way ANOVA followed by Dunnett’s multiple comparisons test).

