. 2018 Aug 7;7:e38689. doi: 10.7554/eLife.38689

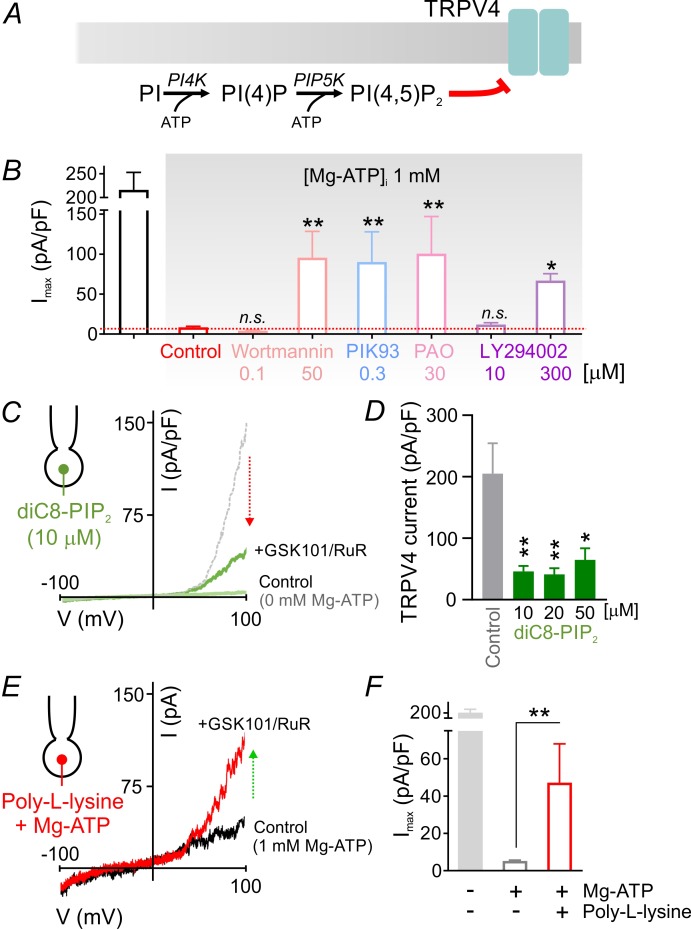
Figure 3. PIP2 mediates tonic inhibition of capillary TRPV4 channels.

(A) Schematic diagram showing the ATP-dependent synthesis steps leading to the production of PIP2. (B) Average maximum outward TRPV4 current induced by 100 nM GSK101, recorded in cECs at 100 mV using the conventional whole-cell configuration. cECs dialyzed with 1 mM Mg-ATP were treated for ~10 min with wortmannin (0.1, 50 µM), PIK93 (0.3 µM), PAO (30 µM) or LY294002 (10, 300 µM), or were left untreated (control). A minimum duration of 10–15 min after the application of GSK101 was allowed for outward TRPV4 current to develop in each cEC. Data are means ± SEM (**p<0.01, *p<0.05 vs. control Mg-ATP, one-way ANOVA followed by Dunnett’s multiple comparisons test; n = 6–27). (C) Traces of current-voltage relationship obtained from a cEC dialyzed with 10 µM diC8-PIP2 and 0 mM Mg-ATP using a voltage ramp (−100 to 100 mV) before and after (green) the application of GSK101 (100 nM) and RuR (1 µM). The dotted gray trace is a representative GSK101-induced current recorded from a control cEC dialyzed with 0 µM diC8-PIP2 and 0 mM Mg-ATP. (D) Summary data showing GSK101 (100 nM)-induced currents at 100 mV in cECs dialyzed with different concentrations of diC8-PIP2 (10, 20, 50 µM) or 0 µM phosphoinositide (control). The pipette solution lacked Mg-ATP in all groups. GSK101-evoked outward currents developed over ~5 min. Data are presented as means ± SEM (*p<0.05, **P<0.01, one-way ANOVA followed by Dunnett’s multiple comparisons test; n = 10–18). (E, F) Representative trace (E) and summary data showing GSK101-induced currents in cECs dialyzed with 1 mM Mg-ATP and poly-L-lysine (3 µg/ml). A duration of 10 min was allowed after the application of GSK101 for outward TRPV4 current to develop in each cEC. Data in F are presented as means ± SEM (**p<0.01, unpaired Student’s t-test; n = 8–18).

Figure 3—source data 1. Numerical data that were used to generate the chart in Figure 3B.
DOI: 10.7554/eLife.38689.017
Figure 3—source data 2. Numerical data that were used to generate the chart in Figure 3D.
DOI: 10.7554/eLife.38689.018
Figure 3—source data 3. Numerical data that were used to generate the chart in Figure 3F.
DOI: 10.7554/eLife.38689.019

Figure 3.

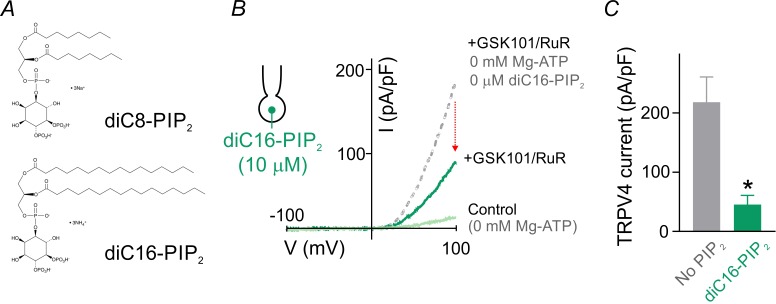
Figure 3—figure supplement 1. The long-acyl chain PIP2, diC16-PIP2, suppresses TRPV4 currents.

Figure 3—figure supplement 1.

(A) Chemical structures of short (dioctanoyl, diC8-PIP2) and long (dipalmitoyl, diC16-PIP2) acyl chain PIP2 salts used in this study. (B) Current-voltage relationship represents currents obtained from a cEC dialyzed with 10 µM diC16-PIP2 and 0 mM Mg-ATP before (light green) and after (dark green) the application of GSK101 (100 nM) and RuR (1 µM), recorded using a voltage ramp (−100 to 100 mV). Outward current developed over 5 min. The dotted gray trace is a representative GSK101-induced current recorded from a control cECs dialyzed with 0 mM diC16-PIP2 and 0 mM Mg-ATP. (C) Summary data showing GSK101 (100 nM)-induced currents at 100 mV in cECs dialyzed with diC16-PIP2 (10 µM) or 0 µM phosphoinositide (control). The pipette solution lacked Mg-ATP in both groups. Data are presented as means ± SEM (*p<0.05, unpaired Student’s t-test; n = 3–4 cECs).
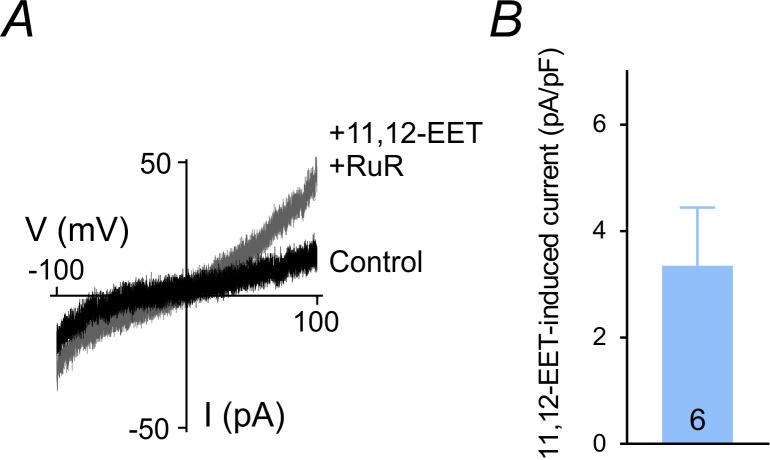
Figure 3—figure supplement 2. 11,12-EET-induced currents in cECs.

Figure 3—figure supplement 2.

(A) Current-voltage relationship represent currents obtained from a cEC dialyzed with 0 µM diC8-PIP2 and 0 mM Mg-ATP before (control) and after the application of 11,12-EET (1 µM) and RuR (1 µM), recorded using 300 ms voltage ramps (−100 to 100 mV). (B) Summary data showing 11,12-EET-induced outward currents at 100 mV in dialyzed cECs based on experiments in A (n = 6 cECs).