. 2018 Aug 7;7:e38689. doi: 10.7554/eLife.38689

Figure 5. PGE2 relieves PIP2-mediated TRPV4 channel suppression.

(A) Representative current-voltage plots obtained from a cEC dialyzed with 1 mM Mg-ATP and treated consecutively with GSK101 (100 nM) and RuR (1 µM) followed by 2 µM PGE2. (B) Summary individual-value plot of GSK101-induced TRPV4 currents at 100 mV in cECs dialyzed with 1 mM Mg-ATP in the absence (black; n = 27) and presence (orange; n = 15) of 2 µM PGE2. Incubation of cECs with PGE2 lasted ~15 min. Data in B are means (column bars) ± SEM (error bars, ****p<0.0001, unpaired Student’s t-test). (C) Top: Schematic diagram showing the GqPCR-dependent hydrolysis of PIP2 and the interventions used to test different components of the proposed pathway. Bottom: Summary data showing GSK101 (100 nM)-induced currents recorded at 100 mV in cECs dialyzed with 1 mM Mg-ATP. Currents were recorded in the absence and presence of 2 µM PGE2 (orange shading), with or without (control) the indicated interventions. Concentrations (and application method): HC-067047, 1 µM (bath); diC8-PIP2, 10 µM (pipette), U73122, 10 µM (bath); U73343, 10 µM (bath); AH6809, 10 µM (bath); SC51322, 1 µM (bath); calphostin C, 0.5 µM (bath); Gö6976, 1 µM (bath); CPA, 30 µM (bath); BAPTA, 5.4 mM (pipette). For bath application, pharmacological agents were added 10–15 min before PGE2 application.

Figure 5—source data 1. Numerical data that were used to generate the chart in Figure 5B.
DOI: 10.7554/eLife.38689.025
Figure 5—source data 2. Numerical data that were used to generate the chart in Figure 5C.
DOI: 10.7554/eLife.38689.026

Figure 5.

Figure 5—figure supplement 1. PGE2 relieves TRPV4 current inhibition.

Figure 5—figure supplement 1.

(A) Current-voltage relationship recorded in a cEC dialyzed with 1 mM Mg-ATP using voltage ramps (−100 to 100 mV). The circled numbers indicated the sequential and cumulative application of GSK101 (100 nM)+RuR (1 µM) followed by 2 µM PGE2 and lastly, the TRPV4 blocker HC-067047 (1 µM). (B) Representative scatter plots of peak current amplitudes (at 100 mV) in three cECs dialyzed with 1 mM Mg-ATP and treated with 100 nM GSK101 followed by 2 µM PGE2 (or PGE2 first followed by GSK101). Note that PGE2-induced activation of TRPV4 current plateaued after ~13–15 min. (C) Scatter plots of normalized GSK101-induced outward currents (at 100 mV), normalized to the current at zero time, I0 (when 2 µM PGE2 was applied), in two cECs, one dialyzed with 1 mM Mg-ATP (orange symbols) and the other dialyzed with 1 mM Mg-ATP +10 µM diC8-PIP2 (black symbols). Currents normalized to I0 are presented before and after the application of PGE2 for 35 min.
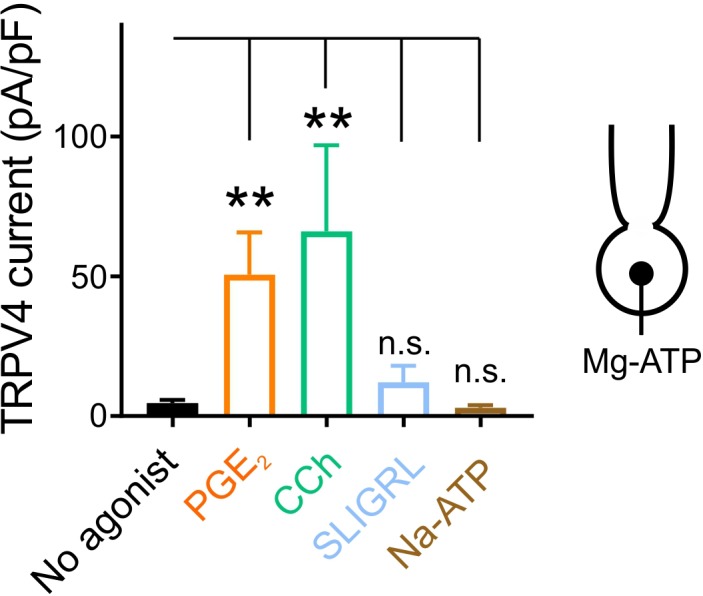
Figure 5—figure supplement 2. Different GqPCR agonists differentially regulate TRPV4 activity.

Figure 5—figure supplement 2.

Summary data showing TRPV4 currents evoked by 100 nM GSK101 at 100 mV in Mg-ATP (1 mM)-dialyzed cECs. Cells were treated with GSK101 alone (no agonist) or together with the GqPCR agonist PGE2 (2 µM), carbachol (CCh; 10 µM), SLIGRL (5 µM), or Na-ATP (50 µM). cECs were incubated with different agonists for 15 min while TRPV4 current development was monitored. Data are presented as means ± SEM (**p<0.01, one-way ANOVA followed by Dunnett’s multiple comparisons test; n = 11–17 cECs).