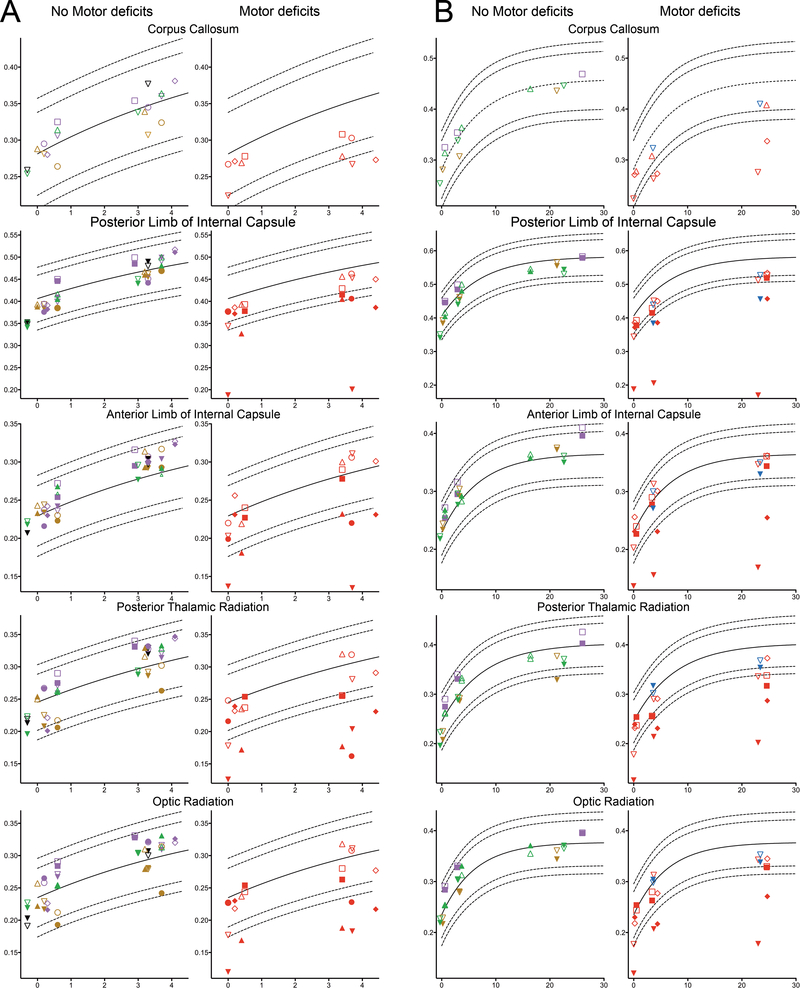
Figure 2:
The FA values (vertical axis) in the different ROIs versus the age at scan (horizontal axis) of 16 infants who were scanned in the neonatal period and at three months (A) and of the 8 infants who were also scanned at 24 months (B), shown for infants with a normal motor development (left column) and with development of motor deficits (right column). The FA value of the affected side is depicted as a filled symbol, while the unaffected side is depicted by the corresponding open symbol. For the corpus callosum, the mean FA was determined and depicted. The different colours represent the different kinds of strokes observed: main branch MCA stroke (red), posterior branch MCA stroke (green), cortical MCA branch (purple), lenticulostriate branch MCA stroke (black) and PCA stroke (brown). The child with the antenatal MCA stroke is depicted as the upside down triangle. The dashed lines represent the 95% and 99% prediction intervals for each ROI, based on the controls.

