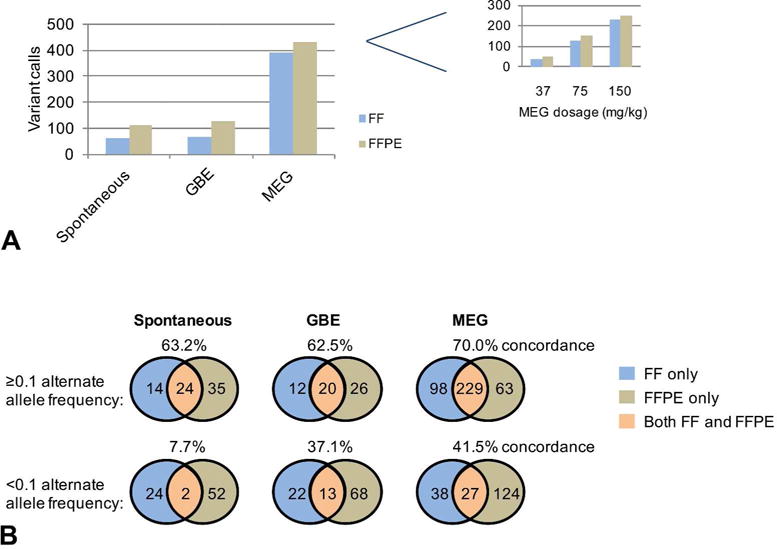
Figure 2.

Non-synonymous mutational burdens in FF and FFPE samples. (A) The total numbers of non-synonymous mutations are shown for sets of Spontaneous (n=3), GBE (n=4) and MEG (n=3) tumors that were processed as FF and FFPE samples. The inset shows the numbers of non-synonymous mutations identified in individual MEG samples from mice treated at the specified dosages. (B) Venn diagram of the total numbers of non-synonymous mutations identified uniquely in the FF or FFPE samples and in both FF and FFPE samples for Spontaneous, GBE and MEG sets of tumors at higher (≥0.1) or lower (<0.1) alternate allele frequency. The concordance was calculated as a percentage of FF mutations that were also identified in the FFPE samples.
