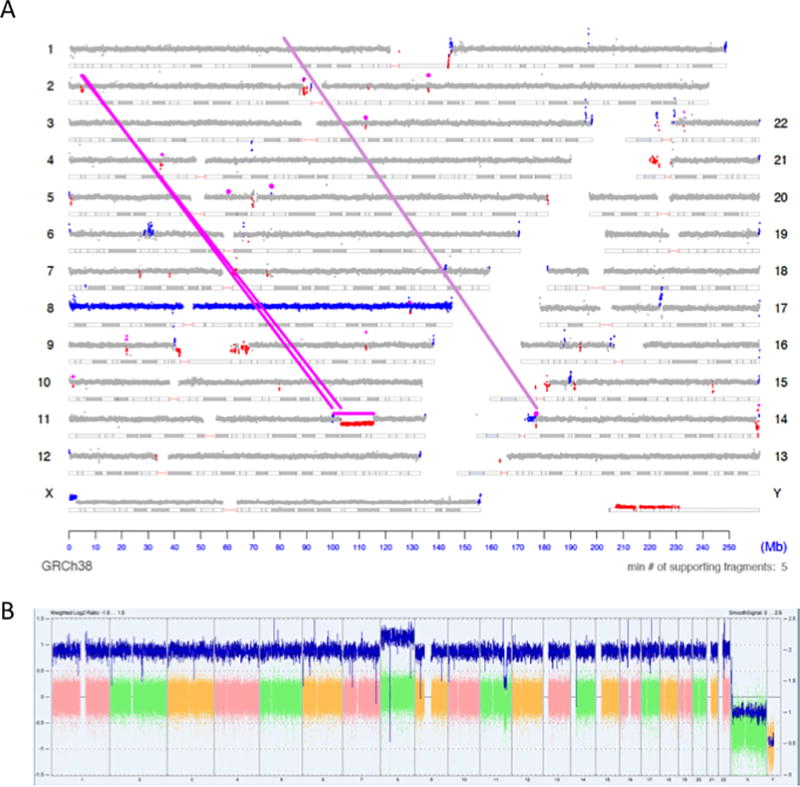
Figure 2. Visualization of BMD SV Pipeline results for MPseq data.

2A) The output of the BMD SV Pipeline for case EV88086 is presented as a genome plot. This plot depicts the read depth of the sequencing data as dots along a chromosome’s length. A magenta line is drawn where there is evidence of a chromosomal junction between two disparate locations in the genome. Regions where CNVs have been detected by the CNVDetect algorithm are colored red to indicate a loss in genomic material and blue to indicate a gain in genetic material. 2B) For comparison the CMA data for EV88086 is provided as visualized by ChAS.
