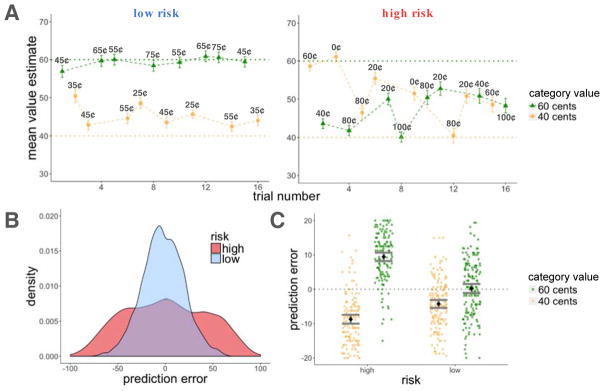
Figure 3.
Experiment 1, learning results. A: Average estimates for the high and low-value categories as a function of trial number for the high and low-risk rooms. Participants learned better in the low-risk room, indicated by the proximity of their guesses to the true values of the scenes (dashed horizontal lines). Cent values represent the outcome participants received on that trial (after entering their value estimate). B: Density plot of prediction errors (PEt) in each room. There were more high-magnitude prediction errors in the high-risk in comparison to the low-risk room. C: There was an interaction for positive and negative prediction errors between risk context and category value, such that participants overestimated the value of the low-value category and underestimated the value of the high-value category to a greater extent in the high-risk room. Error bars represent standard error of the mean.

