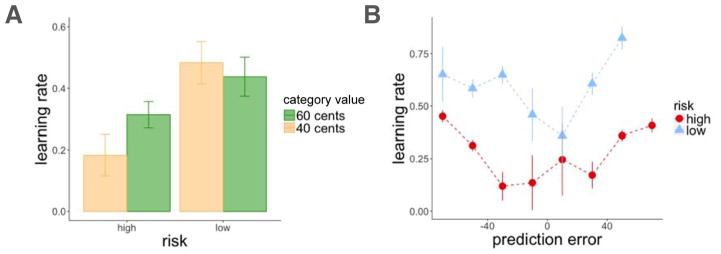
Figure 5.
Experiment 1, learning rate results. A: Learning rate was higher in the low-risk context. Average learning rate plotted by risk context and category value. B: Both absolute prediction errors and a low-risk context increased learning rate. Learning rates were binned by prediction errors that occurred on the same trial (each dot represents the average prediction error within the binned range). Error bars represent standard error of the mean.

