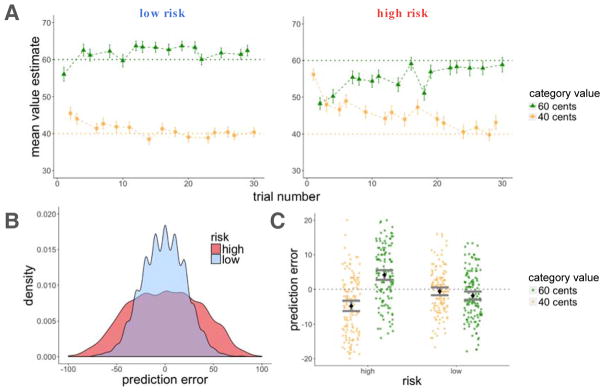
Figure 6.
Experiment 2, learning results. A: Average estimates for the high and low-value categories as a function of trial number for the high and low-risk rooms. Participants learned better in the low-risk room, indicated by the proximity of their guesses to the true values of the scenes (dashed horizontal lines). B: Density plot of prediction errors (PEt) in each room. There were more high-magnitude prediction errors in the high-risk in comparison to the low-risk room. C: There was an interaction for positive and negative prediction errors between risk context and category value, such that participants overestimated the value of the low-value category and underestimated the value of the high-value category to a greater extent in the high-risk room. Error bars represent standard error of the mean.

