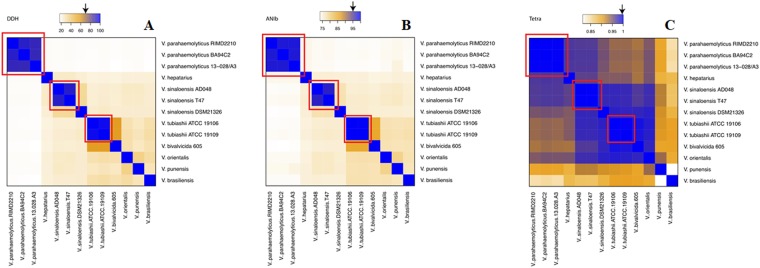
Figure 9.
Heatmaps representing metrics for the evaluation of species circumscription among Vibrio strains. The extent of nucleotide identity was calculated by different indices for species circumscription: DDH (A), ANIb (B) and Tetra (C) as illustrated. The key color was constituted by orange and blue as indicated. Arrows shows the reported cut-off for species a boundary. Red boxes shows clusters of genomes within the reported cut-off.The species and strain number of samples are shown.

