Fig. 1.
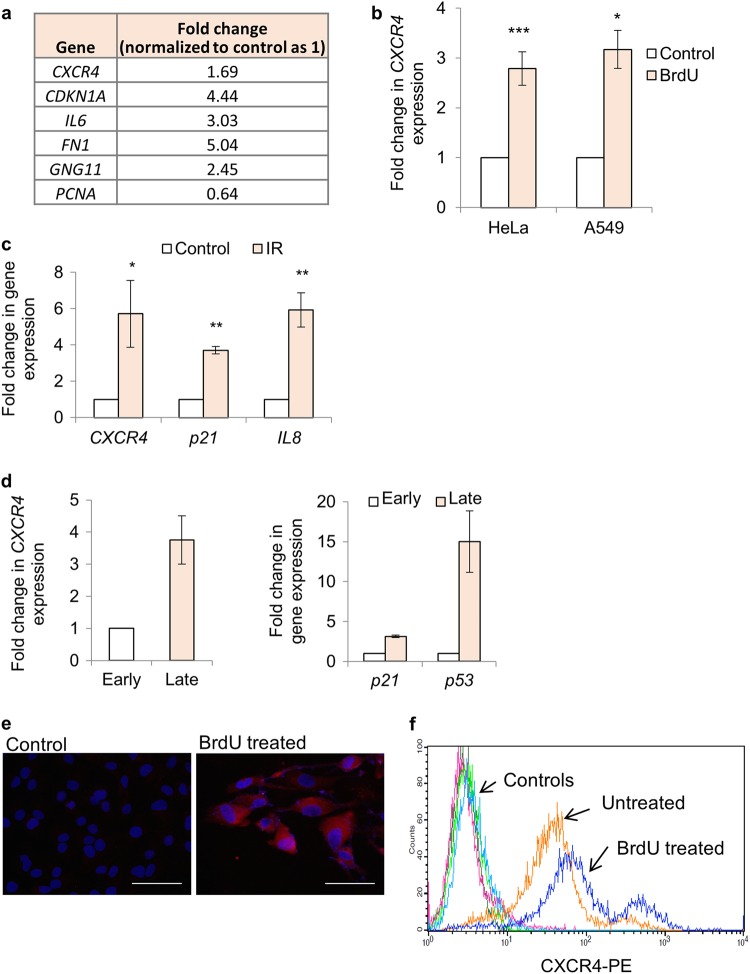
CXCR4 expression analysis in response to DNA damage. a Gene expression changes after BrdU treatment in HeLa cells. Expression pattern of genes as indicated after 48 h of BrdU treatment (100 μM) by microarray analysis. Data extracted from the microarray experiment is reported in Supplementary Fig. S1a (n = 2). The numbers indicate fold change in gene expression during BrdU treatment wrt Control (normalized as 1). b CXCR4 gene expression analysis after DNA damage. HeLa and A549 cells were treated for 48 h with 100 μM BrdU followed by qRT-PCR analysis of CXCR4 expression. The values were normalized to β-actin expression and then wrt control cells to calculate fold changes. Results shown are mean ± s.e.m. *p ≤ 0.05; ***p ≤ 0.001 (Student’s t-test; n > 3). c Gene expression analysis during IR-mediated DNA damage. Expression analysis of CXCR4, p21, and IL8 after irradiation of HF-hTERT cells using qRT-PCR. The values were normalized to β-actin expression and then wrt control cells to calculate fold changes. Results shown are mean ± s.e.m. *p ≤ 0.05; **p ≤ 0.01 (Student’s t-test; n > 3). d Gene expression analysis during replicative exhaustion mediated DNA damage and senescence. Expression analysis of CXCR4 (left) and DDR genes P21 and P53 (right) in early (20 PDL) and late (40 PDL) passage MRC5 cells by qRT-PCR. The values were normalized to β-actin expression and then wrt control cells to calculate fold changes (n = 2). e Immunofluorescence and f surface expression analysis of CXCR4 receptor by flow cytometry. HeLa cells were probed for CXCR4 expression as per the protocol described in Materials and methods section. (magnification 40×; scale bar = 40 µm; n = 5 for e and n = 3 for f)

