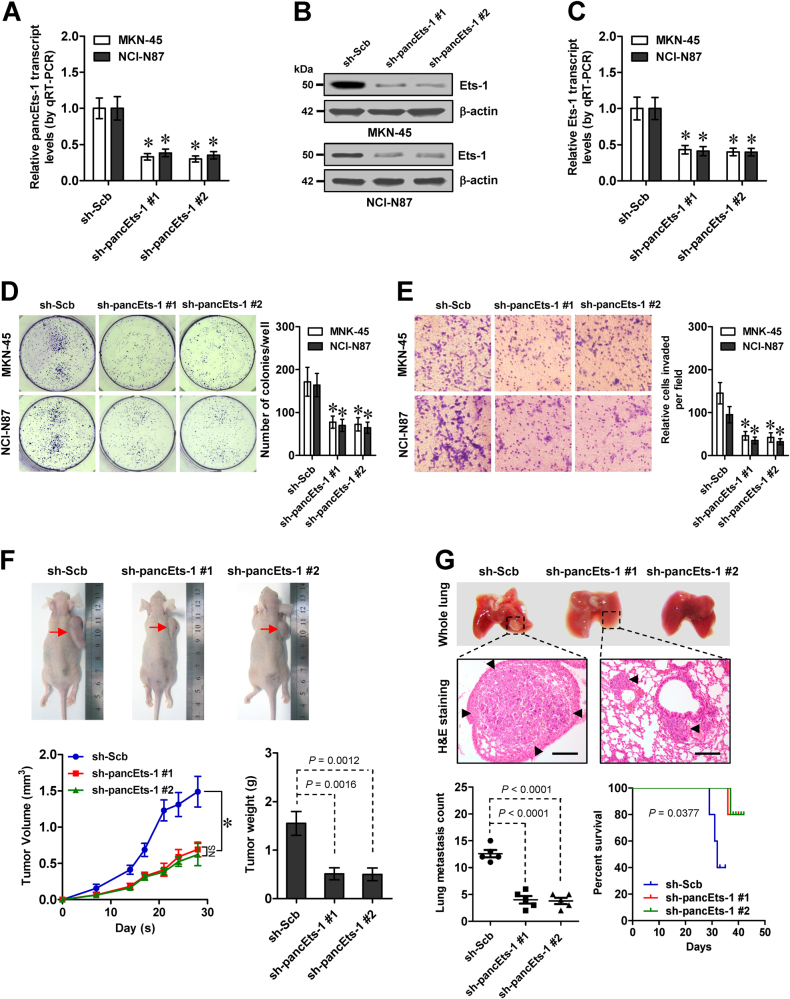
Fig. 2.
Knockdown of pancEts-1 leads to suppression of gastric cancer progression. a Real-time qRT-PCR indicating the pancEts-1 transcript levels (normalized to β-actin) in gastric cancer cells stably transfected with two independent shRNAs against pancEts-1 (sh-pancEts-1 #1 and sh-pancEts-1 #2), compared with scramble shRNA (sh-Scb; mean ± SD, n = 5). b, c Western blot (b) and real-time qRT-PCR (c) showing the protein and transcript levels of Ets-1 (normalized to β-actin) in MKN-45 and NCI-N87 cells stably transfected with sh-Scb, sh-pancEts-1 #1, or sh-pancEts-1 #2 (sh-Scb; mean ± SD, n = 5). d, e Colony formation (d) and transwell matrigel invasion (e) assays depicting the change in growth and invasiveness of gastric cancer cells stably transfected with sh-pancEts-1 #1 and sh-pancEts-1 #2, compared with sh-Scb (mean ± SD, n = 5). f Representative images (upper), in vivo growth curve (lower left), and tumor weight at the end points (lower right) of xenografts formed by subcutaneous injection of MKN-45 cells stably transfected with sh-Scb, sh-pancEts-1 #1, or sh-pancEts-1 #2 into the dorsal flanks of nude mice (n = 5 for each group). g Representative images (upper), HE staining (arrowheads, middle), and quantification (lower left) of lung metastatic colonization and Kaplan–Meier curves (lower right) of nude mice treated with tail vein injection of MKN-45 cells stably transfected with sh-Scb, sh-pancEts-1 #1, or sh-pancEts-1 #2 (n = 5 for each group). Student’s t test and analysis of variance compared the difference in a and c–g. Log-rank test for survival comparison in g. *P < 0.01 vs. sh-Scb. NS, not significant

