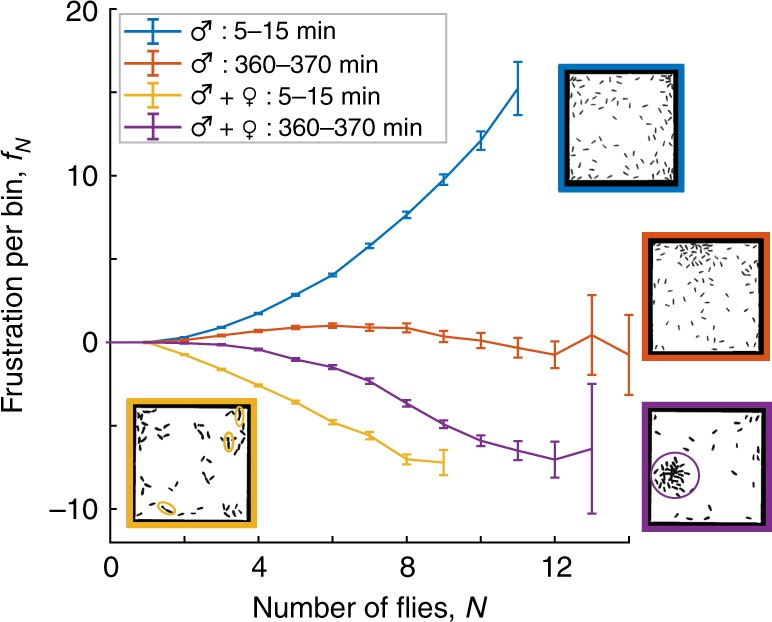
Fig. 4.

Extracting frustrations to quantify changing behavior. Frustrations measured for flies in a 4 cm square chamber. The experiment duration was seven hours. The frustrations were extracted from two different 10 minute intervals corresponding to the initial and final stages of experiments on two different populations. The blue curve (90♂) exhibits a positive curvature at all occupancies, indicating an aversion to crowding at all densities. The red curve characterizes interactions for the same population 6 hours later. The lower curvature indicates significantly reduced aversion to grouping. The yellow curve (30♂ + 25♀) exhibits a downward curvature at low occupations, reflecting mating interactions between pairs of flies (yellow ellipses). At higher occupancies, the lack of curvature indicates a more neutral response to changes in occupation number. Finally, the purple curve characterizes interactions for the same mixed-sex population 6 hours later. The downward curvature shifts to higher occupancies and is followed by a region of positive curvature. The corresponding inflection point indicates a preference for group formation with a density of about eight flies per bin. S.d. error bars calculated from the maximum likelihood (ML) covariance matrix of DFFT distribution in Eq. 3
