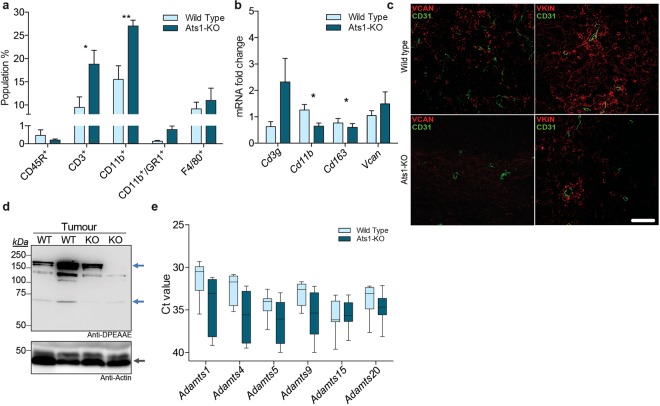
Figure 4.
Characterization of immune infiltration, versican and versicanases in B16F1 tumors in WT and Ats1-KO mice. (a) Graph representing flow cytometry data, as percentage of positive cells of the following populations: CD45R+, CD3+, CD11b+, CD11b+/GR1+, and F4/80+, found in tumours of WT (n = 5) and Ats1-KO (n = 5) mice. (b) Graph representing the relative mRNA fold change expression of Cd3g, Cd11b, Cd163 and Vcan genes in tumours of WT (n = 5) and Ats1-KO (n = 5) mice. (c) Representative images of tumour sections from WT and Ats1-KO mice, showing VCAN and VKIN (red) (left and right column, respectively), and CD31 (green) immunofluorescence staining. Images correspond to a 63x magnification (white scale bar = 20 μm). (d) Western blot analysis with anti-DPEAAE antibody for ADAMTS-cleaved versican in tumour protein extracts from WT and Ats1-KO mice. Blue arrows indicate predicted versican (V0/V1) fragments (around 220 kDa and 70 kDa). Bottom panel includes actin staining (grey arrow). Full-length blots are presented in Supplementary Figure 6. (e) Graph representing the absolute Ct value for mRNA expression of Adamts1, 4, 5, 9, 15, and 20 genes in tumours of healthy WT (n = 9) and Ats1-KO (n = 8) mice (values higher than 37–38 are considered very low or absent). For all the graphs, results are shown as the median with s.e.m. and statistical significance (*p < 0.05; **p < 0.01).

