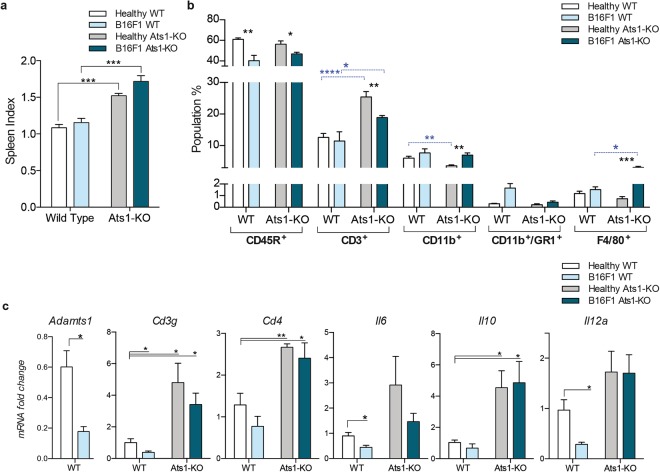
Figure 5.
Characterization of spleens from B16F1 tumour-bearing WT and Ats1-KO mice. (a) Graph representing spleen index (as indicated in Methods section) of healthy and tumour-bearing mice (WT, n = 6; Ats1-KO, n = 5) to assess splenomegaly. (b) Graph representing flow cytometry data, as percentage of positive cells of the following populations: CD45R+, CD3+, CD11b+, CD11b+/GR1+, and F4/80+, found in spleens of healthy WT (n = 6) and tumour-bearing WT (n = 5), and healthy Ats1-KO (n = 5) and tumour-bearing Ats1-KO (n = 5) mice. Blue-dashed bars represent comparison between WT and Ats1-KO groups. (c) Graph representing the mRNA fold change expression of Adamts1, Cd3g, Cd4, Il6, Il10, and Il12a in spleens of healthy WT (n = 5) and tumour-bearing WT (n = 5) and healthy Ats1-KO (n = 5) and tumour-bearing Ats1-KO (n = 6) mice. All values are relative to healthy WT. For all the graphs, results are shown as the median with s.e.m. and statistical significance (*p < 0.05; **p < 0.01; ***p < 0.001; ****p < 0.0001).

