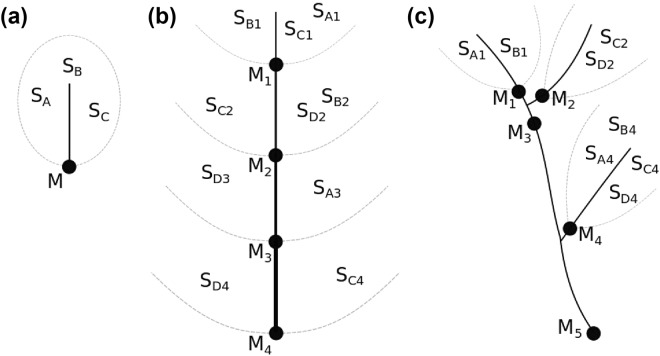
Figure 1.
Example experimental designs demonstrating how MixSIAR apportions sources in hierarchical river networks. In all designs, rivers flow downward, filled circles represent nodes at which sediment mixture (Mix = M) samples could be collected, and dashed grey lines delineate watersheds (S) denoted by subscript numbers, and subscript letters indicate unique sources. (A) Simple watershed with three sources, SA-C, and one mixture location at the outflow, M. (B) Longitudinal system with four sources, SA-D, and multiple mixture locations at the outlet of each nested subwatershed, M1–4. (C) Distributed system with mixtures at the outflow of each of three subwatersheds, M1, M2, and M4, four sources (SA-D), as well as mixtures on the main channel: M3 and M5. (note: not all sources are present in all subwatersheds).

