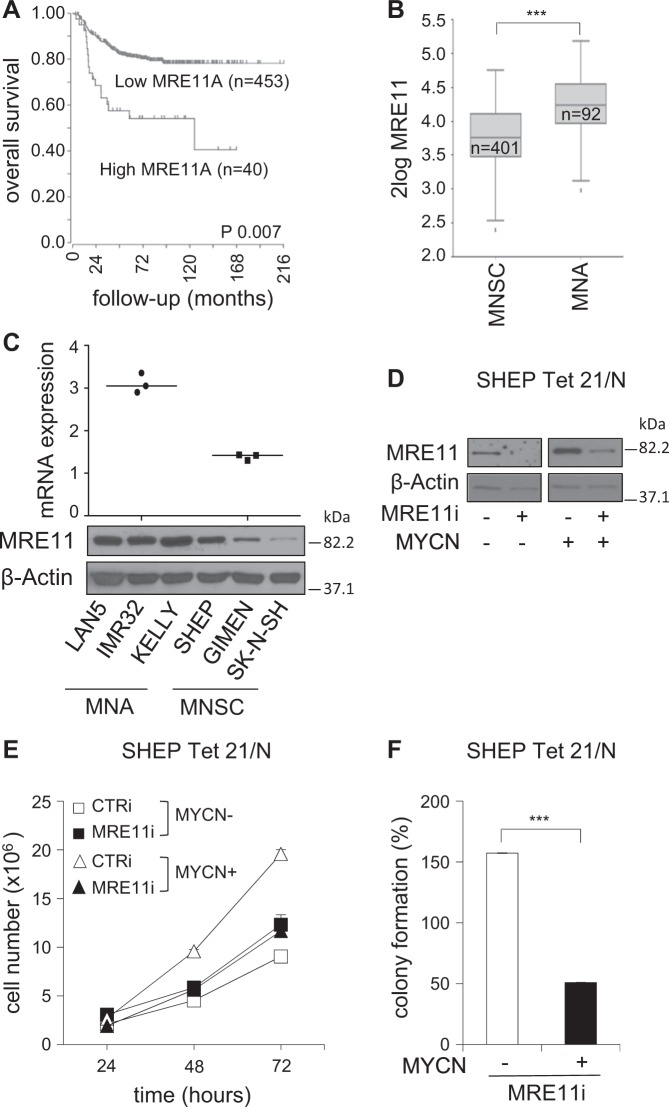
Fig. 1. MRE11 expression correlates with poor prognosis and MYCN status in neuroblastoma patients and its depletion affects MYCN-dependent proliferation/survival in vitro.
a Kaplan–Meier curves reporting patients’ overall survival probability with respect to MRE11 expression. Scan-modus was used for cut-off determination with a minimum group size of 8 to determine the best p-values in a log-rank test (high and low expression as defined in Figure S1). p-Value was adjusted using Bonferroni correction test for multiple testing. b Box plot of MRE11 expression relative to MYCN status. The best p-value was calculated using R2-Genomics analysis and visualization platform by the Student’s t-test. ***p < 0.001. c MRE11 mRNA and protein expression as measured by real-time Q-PCR (upper panel) and western blot (WB) analysis (bottom panel) in MNA (LAN5, IMR32, Kelly) and MNSC (SHEP, GIMEN, SK-N-SH) cell lines. mRNA expression was normalized on GAPDH levels. WBs were probed with β-actin as a loading control. d–f MYCN+ and MYCN− SHEP Tet21/N cells were subjected to MRE11 knockdown by shRNA interference (MRE11i) and to a short round of puromycin selection. No-target shRNA interference (CTRi) was used as control. Cells were analyzed for MRE11 and β-actin protein expression (d) and used for cell proliferation assays (e) (data represent mean ± SD of three independent experiments) and colony formation assays (f) (average data obtained by three independent experiments are expressed as percentage compared to CTRi-treated controls ± SD). p was calculated by the Student’s t-test. ***p < 0.001

