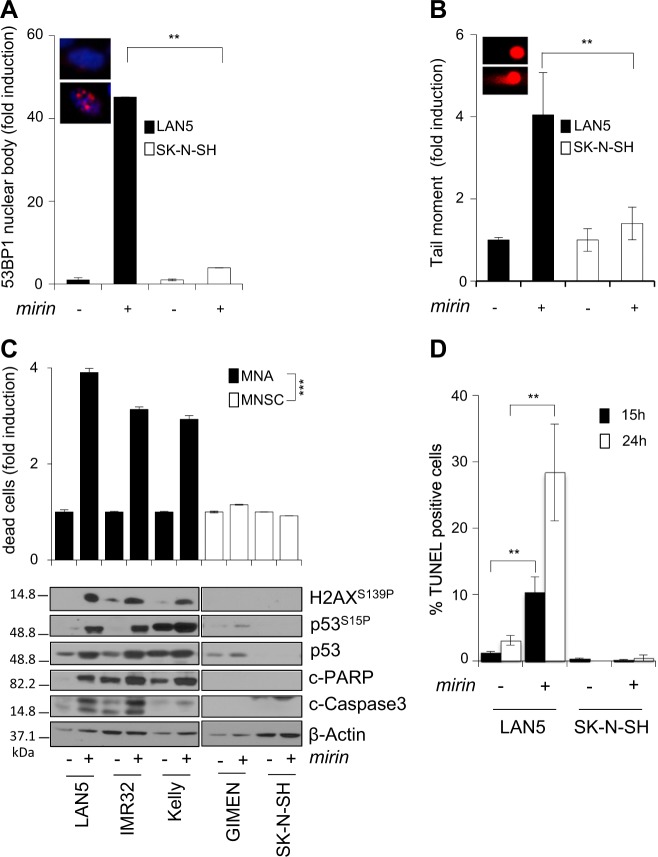
Fig. 3. Mirin induces DNA damage, DDR, and cell death in MNA cell lines.
a, b Percentage of cells showing >3 53BP1 nuclear bodies (a) and DNA damage as measured by the neutral comet assay (b), performed in LAN5 (MNA) and SK-N-SH (MNSC) cell lines treated with mirin or vehicle, for 5 h. For all panels, average data obtained by three independent experiments are reported as fold induction compared to untreated controls, ±SD). p-Values were calculated by the ANOVA test. **p < 0.01. Representative images of LAN5 cells treated with DMSO (above) or mirin (below) are given in the insets. c Evaluation of cell death and DDR in MNA (LAN5, IMR32, Kelly) and MNSC (GIMEN, SK-N-SH) cell lines, as measured by the trypan blue exclusion test (upper panel; average data obtained by three independent experiments are reported as fold induction compared to untreated controls, ±SD), and by WB analysis of the indicated proteins and phosphoepitopes (bottom panel), following mirin treatment. p-Values were calculated by the Student’s t-test. ***p < 0.001. d Percentage of TUNEL-positive apoptotic cells in LAN5 and SK-N-SH cell lines, following mirin treatment, for the indicated time points. Data obtained by three independent experiments are reported as percentage compared to untreated controls, ±SD. p-Values were calculated by the Student’s t-test. **p < 0.01

