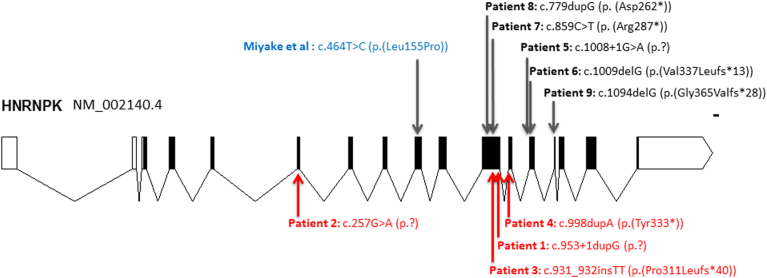
Fig. 1.
Schematic representation of disease-causing HNRNPK mutations on the NM_002140.4 transcript. Introns (lines), coding exons (in black), and non-coding exons (in white) are represented. Published loss-of-function mutations (below) and missense mutation (above) and new mutations (above) are indicated. The scale bar represents 100 base pairs

