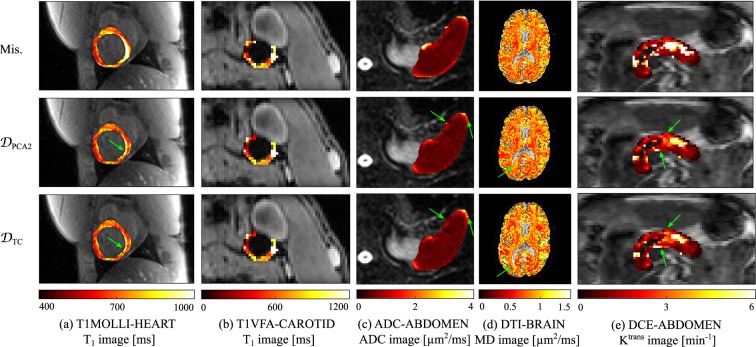
Figure 2.
Tissue maps generated before image registration (top), after image registration with (middle), and after image registration with (bottom). The fitted values are shown in the myocardium for T1MOLLI-HEART, in the carotid artery wall for T1VFA-ABDOMEN, in the spleen for ADC-ABDOMEN, in the brain parenchyma for DTI-BRAIN, and in the pancreas for DCE-ABDOMEN. Slight visual changes between the tissue maps obtained with and are identified by green arrows.

