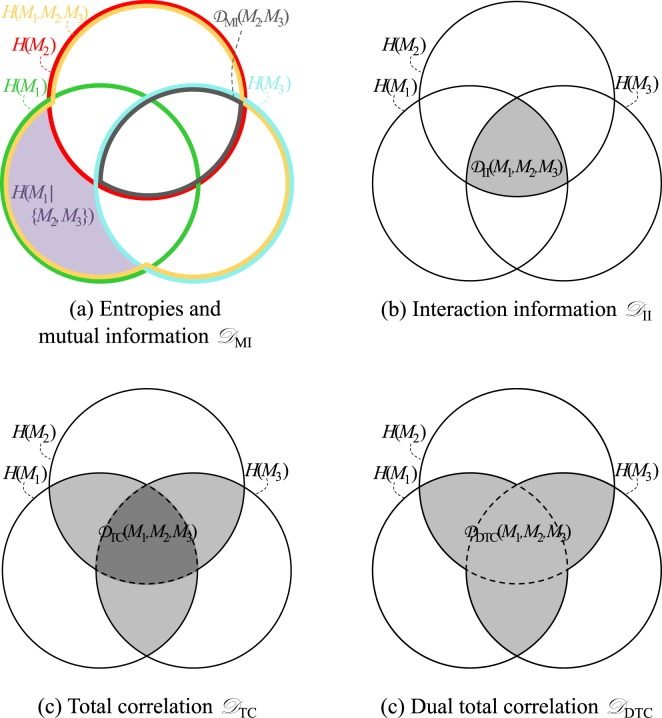
Figure 6.
Venn diagram representations for three images M1, M2 and M3. (a) The green, red and cyan circle represent the entropy of each image. The fact that the images share information is symbolized by the fact that these circles overlap. Subfigures (b), (c) and (d) were constructed based on Equations (3), (5) and (6). In (c), the dark greay area signifies that its contribution to the dissimilarity measure is twice as high as the contribution of each light-grey area.

