Figure 5.

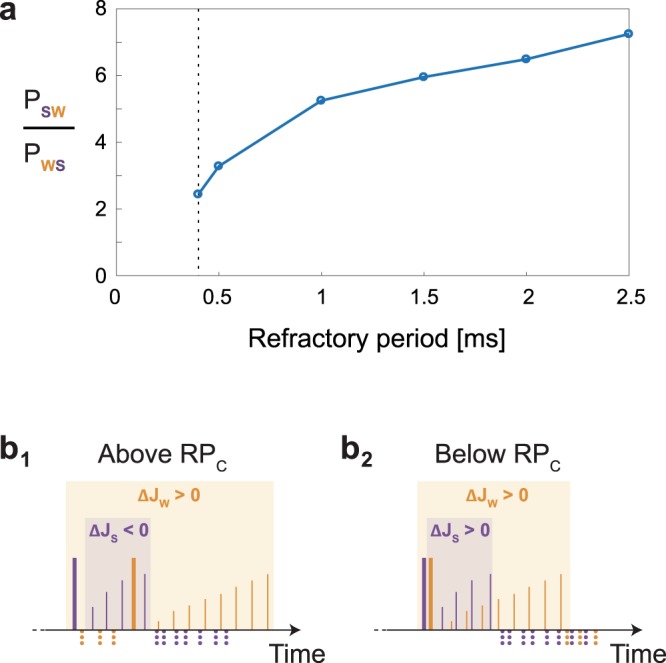
Critical refractory period (RPC). (a) The fraction PSW/PWS as a function of the refractory period for the parameter of Fig. 4b, where PSW stands for the fraction of spikes generated by JS prior to a spike generated by JW in a time windows of 5 ms, and PWS represents the opposite scenario. Results were calculated starting from the minimal possible refractory period, 0.4 ms (black dashed line) where the log-normal distribution was obtained. (b) The most probable scenario, where a weak spike follows a strong one, is demonstrated with accompanied sub-threshold stimulations (solid thin lines) and response failures (dotted lines below the x-axis) for two cases. (b1) Above the critical refractory period (RPC), the time-lag between the spikes is long enough to ensure that most of the strong sub-threshold stimulations (thin purple lines) occur prior to the weak spike, resulting in a total negative adaptive step (ΔJS < 0). (b2) Below RPC, the time-lag between the spikes is too short, thus most of the strong sub-threshold stimulations (thin purple lines) occur after the weak spike, resulting in a total positive adaptive step (ΔJS > 0). Since both ΔJS and ΔJW are positive, all weights are driven to be above-threshold.
