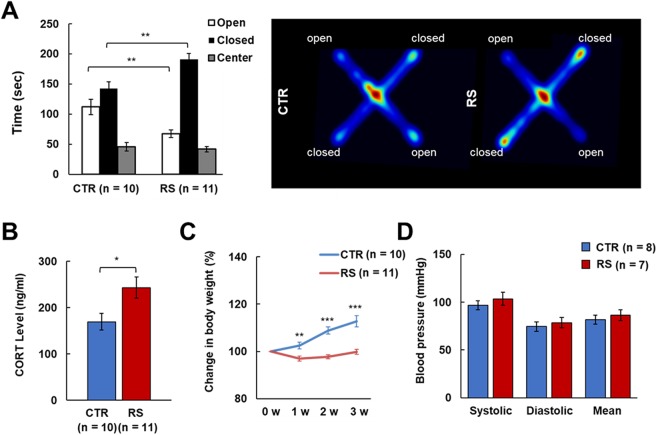
Figure 1.
Validation of the chronic restraint stress (RS) animal model. (A) Cumulative time in open, closed, and center areas in the elevated plus maze (EPM), and heat map of animals’ movements on the EPM. (B) The level of plasma corticosterone (CORT) one day after the last stress exposure. (C) Body weight changes over the 3-week period. (D) Blood pressure one day after the last stress exposure. CTR, control group; RS, restraint stress group; *p < 0.05; **p < 0.01; ***p < 0.001.

