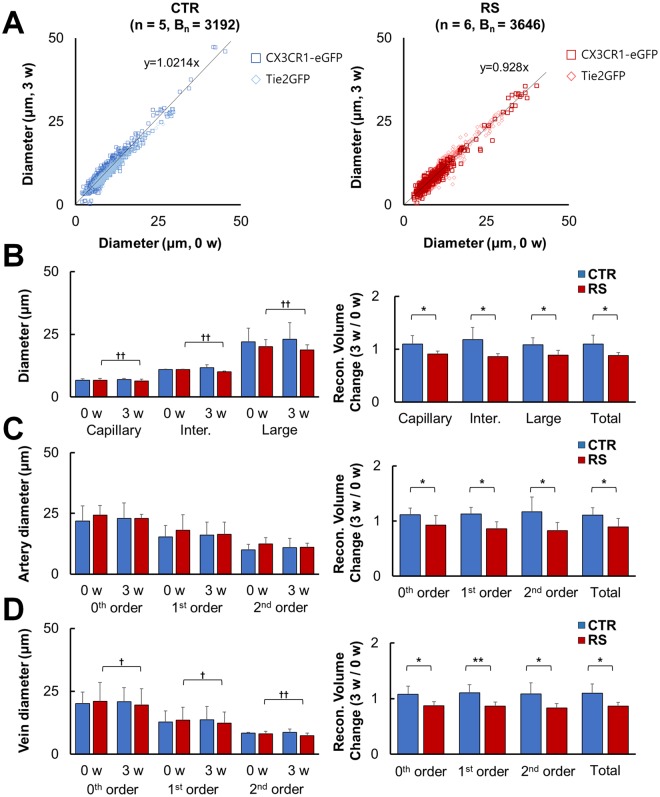
Figure 3.
Volume and diameter of classified vessels based on size, type, and branching order. (A) The correlation of vessel diameter between 0 w and 3 w of the CTR (left) and RS (right). (B) The diameter of vessel at 0 w and 3 w in all sizes of vessels (left), and the reconstructed volume change shown as the ratio to 0 w (right). (C) Artery diameter (left) and reconstructed volume change (right) in the CTR and RS based on branching order. (D) Vein diameter (left) and reconstructed volume change (right) in the CTR and RS based on branching order. CTR, control group; RS, restraint stress group; Bn, number of branches; *p < 0.05; **p < 0.01; †p < 0.05; ††p < 0.01.

