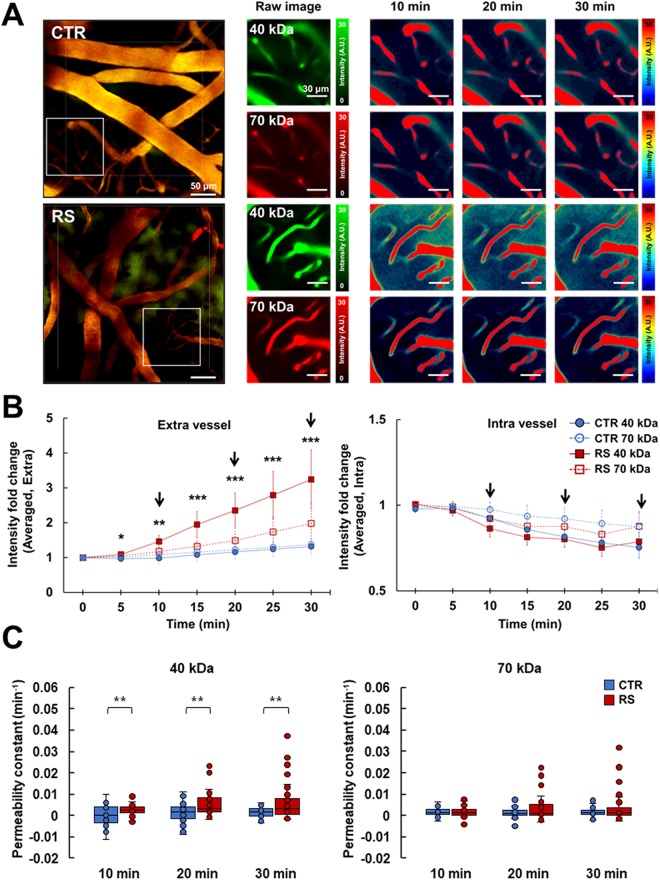
Figure 4.
BBB permeability increases following chronic restraint stress. (A) Representative images of leaking fluorescence-labeled dextran. The middle panel shows the raw images of the insert squares in the left panel. Time-lapse raw images were visualized with the color intensity scale, as shown in the right panel. (B) The intensity of fluorescence in the extravessel (left) and intravessel (right). The intensity of the 40-kDa tracer significantly increased in the extravessel area of the RS from 0 to 30 min. Arrows indicate time points for time-lapse raw images in right panel of A. (C) The permeability constant of the 40-kDa tracer (left) and 70-kDa tracer (right). CTR, control group; RS, restraint stress group; *p < 0.05; **p < 0.01; ***p < 0.001.

