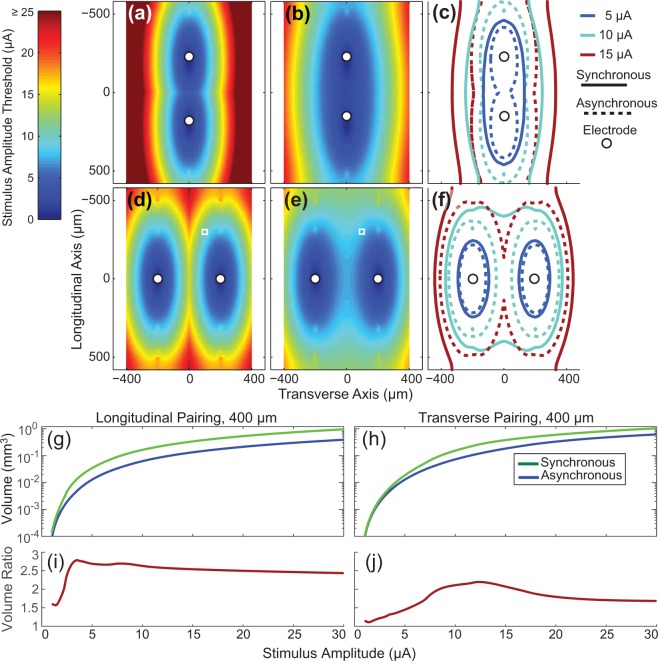
Figure 1.
Computing the volume ratio. For ease of display, threshold results are shown in two dimensions although all numerical results are from computations done in all three-dimensions. Results for (a,b), (d,e) in this figure were computed using a 10 μm diameter fiber. (a) At each location the stimulus threshold of the axon in response to a single electrode stimulus is shown (asynchronous stimulation case). For (a) the electrodes are separated by 400 μm along the longitudinal axis (longitudinal pairing). (b) Similar to (A) except the threshold at each location is for synchronous stimulation. (c) Iso-threshold contours at 5, 10, and 15 μA for both the asynchronous and synchronous stimulation conditions. The solid lines represent the contours for synchronous stimulation and the dotted lines represent contours for asynchronous stimulation. (d–f), are the same as (a,b), and (c) except that they are for a transverse pair of electrodes spaced 400 μm apart. Recruitment volumes are shown in (g,h) for the longitudinal and transverse pairing, respectively. The ratio of recruitment volumes from synchronous stimulation over asynchronous stimulation produces the output variable of interest, the volume ratio (i,j). The small circles in panels a-f represent the location of the electrodes. The small white square in panels (d,e) indicate the spatial location of the center-most node of Ranvier from an axon relative to the electrodes as shown in Fig. 8, and shows how at this location, the threshold value is decreased when both electrodes are stimulating synchronously. Stimulus thresholds above 25 μA in (a) are saturated on the color scale shown to provide better visual detail for other other panels.

