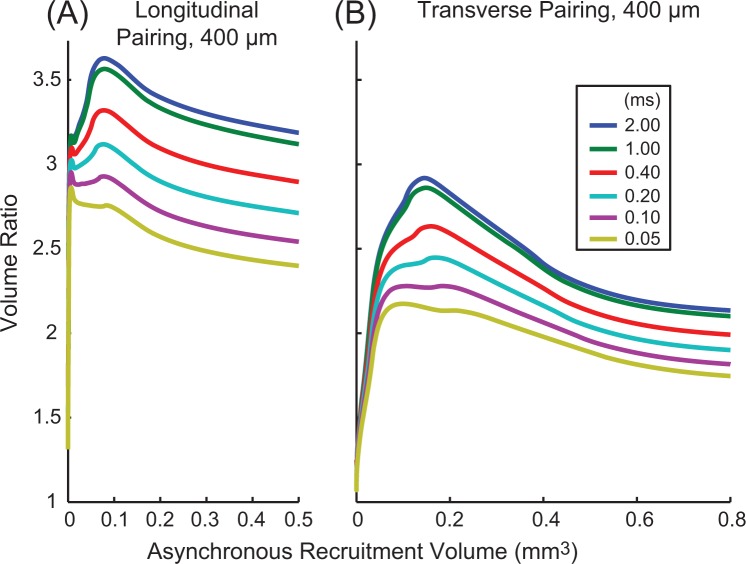
Figure 4.
Volume ratios for different stimulus pulse widths. Volume ratios for electrodes spaced 400 μm apart longitudinally (A) and transversely (B) for different pulse widths. Results shown are for a 15 μm diameter fiber. Ratios are plotted as a function of the volume of tissue recruited during asynchronous stimulation, our measure of stimulation strength/effectiveness, rather than amplitude or charge per phase. Longer pulse-widths had larger changes in recruitment volume during synchronous stimulation.

