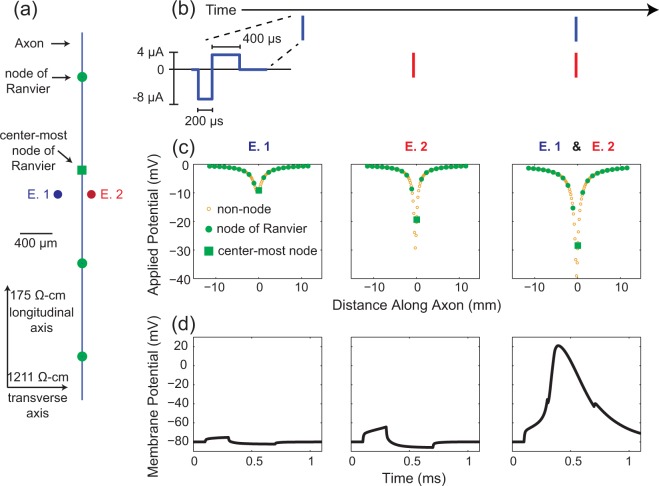
Figure 8.
Synchronous versus non-synchronous stimulation of a single cell. (a) Spatial layout of the model system. Axons run parallel to the longitudinal (z-) axis. A 10 μm diameter fiber is shown with nodes of Ranvier spaced regularly at 1150 μm intervals. In this example, the center node of Ranvier is located 300 μm away from the electrodes along the longitudinal axis, and 300 μm and 100 μm away from electrodes E. 1 and E. 2, respectively along the transverse axis, and at the same depth as the electrodes. The electrodes are thus separated by 400 μm along the transverse-axis (transverse pairing). (b) Diagram of the stimulus-waveform as well as indicating the relative timing to stimulus pulses on both electrodes. For (c,d) the left and middle panels correspond to stimulation on electrodes E. 1 (left) and E. 2 (middle) asynchronously. The right panels correspond to synchronous stimulation on both electrodes. (c) The potentials applied to the axon model from the cathodic phase of the stimulus waveform. The potentials from the anodic phase would have opposite polarities and half the amplitude. Potentials are computed using eqn (1). (d) Membrane potential at the centermost node of Ranvier during the simulation as computed using NEURON. This example demonstrates that although neither electrode is able to activate this axon when stimulated individually, synchronous stimulation on both electrodes elicits an action potential.

