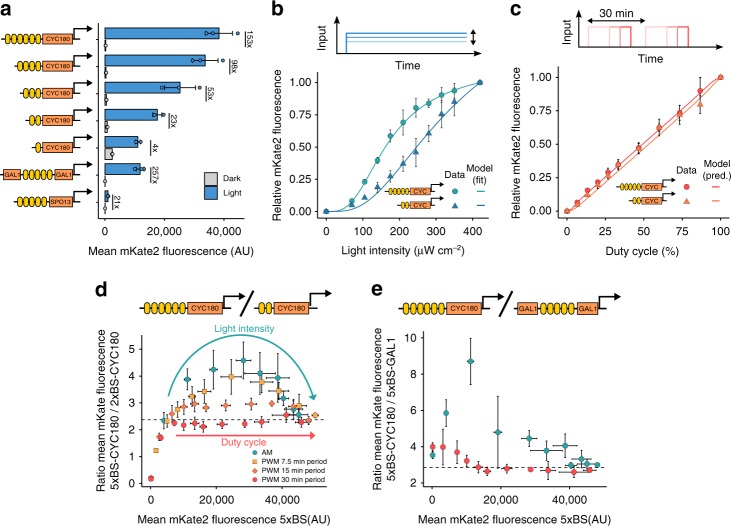
Fig. 2.
Coordinated multi-gene regulation using dynamic inputs. a A promoter library for gene expression at various expression levels. Schematics represent the different promoters. Yellow boxes represent EL222 binding sites and orange boxes represent partial sequences of yeast promoters. Strains, expressing mKate2 under the control of the respective promoter, were cultured for 6 h in the dark or the presence of blue light (350 µW cm−2). The average cellular mKate2 fluorescence was measured using flow cytometry. Data represent the mean and s.d. of three independent experiments. b and c Dose-response of two promoters to AM (b) and PWM (c). Strains expressing mKate2 under the control of either a CYC180 promoter with five (circle, 5xBS) or two (triangle, 2xBS) VP-EL222 binding sites were grown under the illumination conditions depicted on the x-axis for 6 h. The light intensity and period for PWM were 420 µW cm−2 and 30 min. Mean cellular fluorescence measurements were normalized to be 0 in the dark and 1 at the highest input level to allow for easy comparison. Non-normalized values are shown in Supplementary Fig. 7. Data represent the mean and s.d. of three independent experiments. Lines represent model fits or predictions. d Relative gene expression levels for different induction condition. Strains (as in b and c) were grown under the same illumination conditions (light intensity and duty cycle) as shown in b and c. In addition, the effect of the PWM period on coordinated expression was explored. The ratio of mKate2 expression from the 5xBS and the 2xBS promoter is plotted against the mKate2 expression from the 5xBS promoter for the same illumination conditions. The dashed line represents this ratio at constant illumination with a light intensity of 420 µW cm−2. Data represent the mean and s.d. of three independent experiments. e Relative gene expression levels between a CYC180 and GAL1 based promoter with five binding sites for different induction condition. Experiments were performed as described in (d). Data represent the mean and s.d. of three independent experiments for the CYC180-based promoter and two independent experiments for the GAL1-based promoter

