Fig. 5.
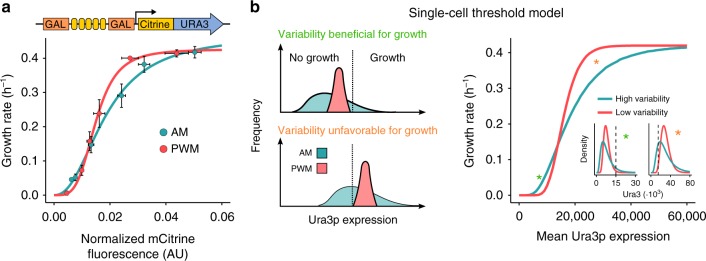
Effect of regulating URA3 expression levels by AM and PWM on cell growth. a Cells expressing mCitrine-tagged Ura3p from the 5xBS-GAL1pr were grown under AM (blue) and PWM (red) light induction for 14 h in media with uracil before transfer to uracil-free media, fluorescence, and growth measurements. PWM was performed with a 30 min period and 420 µW cm−2 light intensity. Growth was measured for 5 h. Hill functions were fit to the data for comparison and guidance (see Supplementary Fig. 14f and Supplementary Table 7 for parameters). The effect of AM and PWM on the CV is shown in Supplementary Fig. 14c. Data represent the mean and s.e.m of three independent experiments. Data of all individual experiments are shown in Supplementary Fig. 14d, e. b The experimental data are consistent with an all-or-none growth response to Ura3p expression on the single-cell level (threshold model). A schematic representation illustrating how cell-to-cell variability combined with a threshold expression level required for growth (dashed line) may affect cellular growth for two different expression levels is shown on the left. For low mean expression levels, expression variability enables growth of a small subpopulation. In contrast, for high expression levels, cell-to-cell variability may lead to a subpopulation that is unable to grow and a subpopulation with unnecessarily high expression levels. The expected relation between mean expression levels and growth rate for the threshold model is shown on the right. Growth rates were calculated by computing the fraction of log-normal distributions with values higher than a threshold level (15,000) and multiplying the resulting fraction by the maximal growth rate of 0.42 h−1. The CV of the log-normal distributions used was 0.6 for the high variability curve (blue) and 0.3 for the low variability curve (red). The insets show the distributions for mean expression levels marked by asterisks in the main figure together with the growth threshold value (dashed line)

