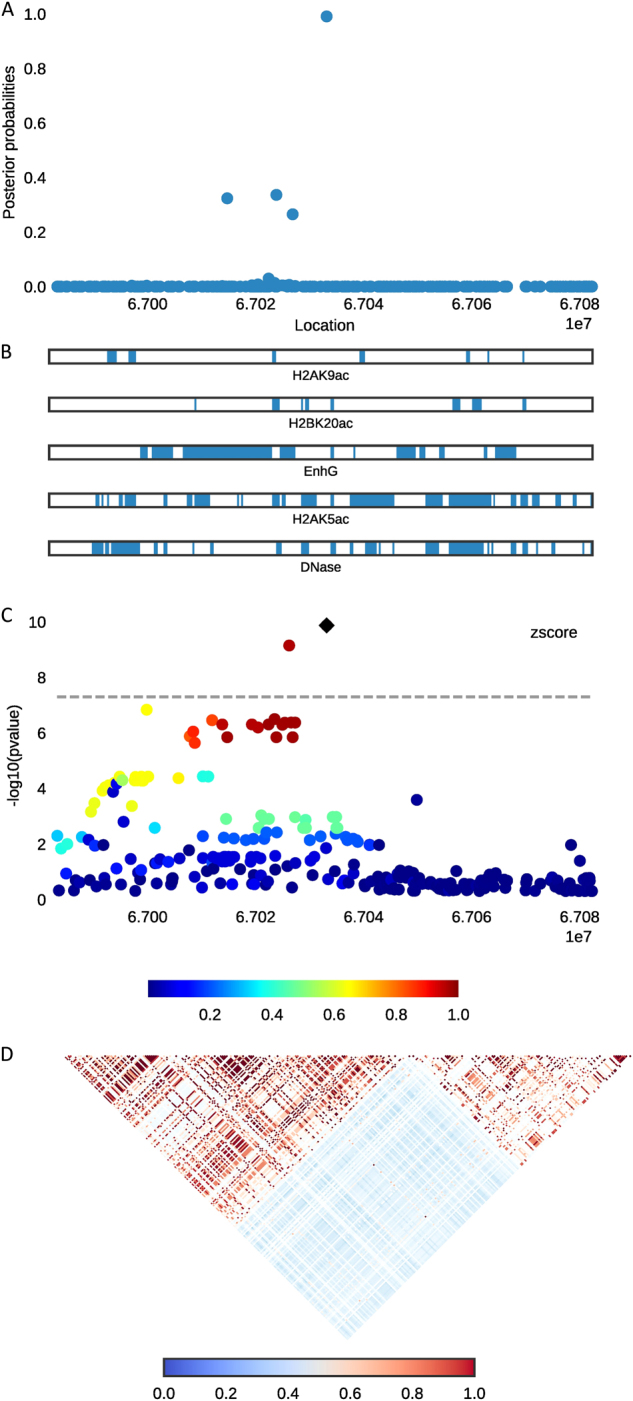
Fig. 1.

Combining regional plots of locus SMAD6 with variants’ scatterplot of posterior probabilities, annotation bars, scatterplot of original signals, and correlation heat-map of LD matrix. Top, a The posterior probability for each variant calculated by PAINTOR after integrating functional annotations and LD correlation. b The relative coverage and location of the top five selected annotations corresponding to the variants above. c A scatterplot that shows the original GWAS signals of each variant in −log10 (p-value) unit. Bottom, d The heat-map of LD structure estimated from 1000 Genome Phase 1 European population
