Figure 2.
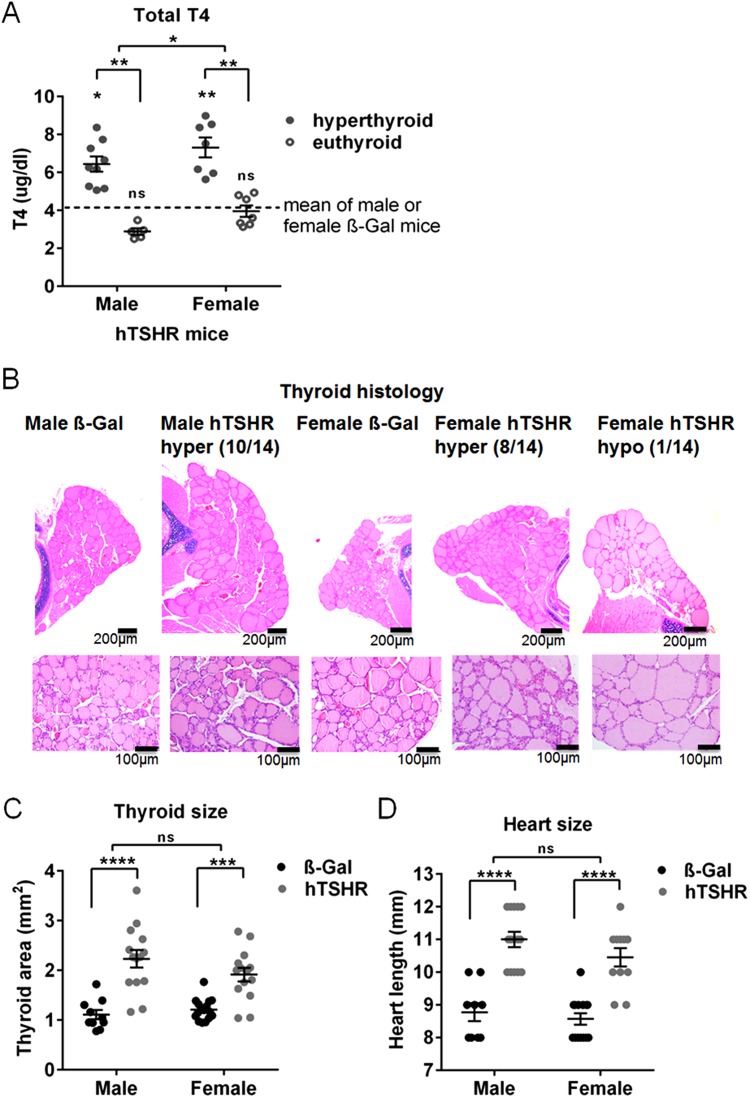
Evaluation of thyroid function and morphology. (A) Total T4 values (µg/dl) were measured by ELISA in serum of male or female ß-Gal (males n = 8, females n = 16) or hTSHR mice (males n = 14, females n = 14). Dotted lines show the mean values obtained from male (4.17 ± 0.79) or female ß-Gal control mice group (4.19 ± 0.33). Male or female hTSHR mice with statistically elevated serum T4 values (hyperthyroid) or unchanged values (euthyroid) compared to euthyroid ß-Gal control mice are shown. Statistical significance is indicated, **p ≤ 0.001, *p ≤ 0.05. (B) Thyroid slices of the animals were H&E stained and thyroid state was evaluated (ß-Gal males n = 10, females n = 16; hTSHR males n = 14, females n = 14). Representative images of thyroids are shown, upper panel magnification x4, lower panel magnification x20. Number of hyperactive (hyper) or hypoactive (hypo) indexed mice are given. Hyperactive thyroids were characterized by increase of total thyroid size, cuboid cylindrical follicular cells with small amount of colloid, thick follicular epithelium. Hypoactive thyroids showed thin follicular epithelium and in some follicles the follicular membrane was almost not visible. For high-magnification pictures see also S1 Fig. (C) Thyroid area was measured in H&E stained thyroid slices and is expressed in mm2. (D) Heart length of individual animals was measured and is expressed in mm (ß-Gal males n = 9, females n = 14; hTSHR males n = 14, females n = 11). Statistical significance is indicated ****p ≤ 0.0001, ***p ≤ 0.001, ns not significant.

