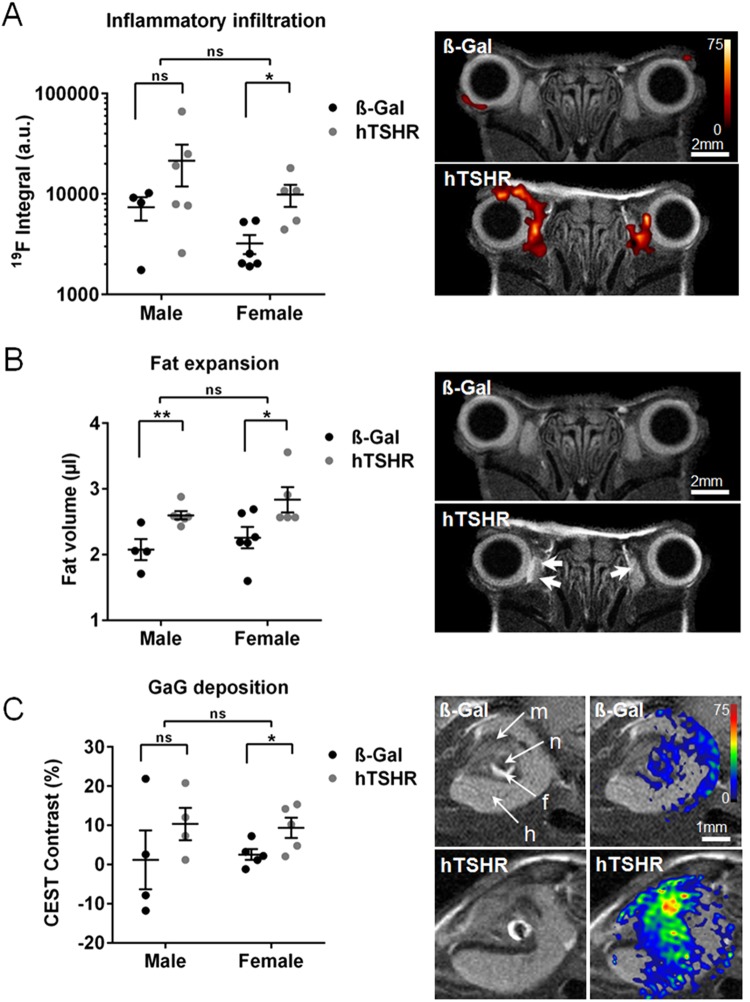
Figure 4.
Detection of key features of orbitopathy by MRI in living mice. Six weeks after the last immunization mice each group (ß-Gal males n = 4, females n = 6; hTSHR males n = 6, females n = 5) were injected with PFC and subjected to serial 1H/19F MRI. Several 1H/19F MRI scans of individual mice were quantificated. Representative MRI images of a male ß-Gal and hTSHR mice are shown. (A) 19F integral of PFC-loaded macrophages/monocytes are expressed in arbitrary units (a.u.). Overlay of corresponding anatomical 1H and 19F MRI images showing massive infiltration of PFC-loaded monocytes/macrophages in orbital tissue. 19F intensity is shown in false color as indicated. (B) T2-weighted 1H MRI. Orbital fat volume is given in (µl). Axial sections are showing expansion of fat tissue in the orbit as indicated by arrows. (C) T2-weighted 1H MRI. 1H CEST contrast of glycosaminoglycans (GAGs) is expressed in %. Three mice showing a weak image quality has been excluded from the CEST analysis; data shown from ß-Gal males n = 4, females n = 4 and hTSHR males n = 5, females n = 5. Oblique sections are showing orbital tissues as indicated (m, muscles; n, nerve; f, fat tissue; h, haderian gland). Overlay of anatomical images and corresponding CEST signal indicating deposition of GAGs. CEST signal is shown in false color as indicated. Statistical significance is indicated **p ≤ 0.01, *p ≤ 0.05, ns not significant.

