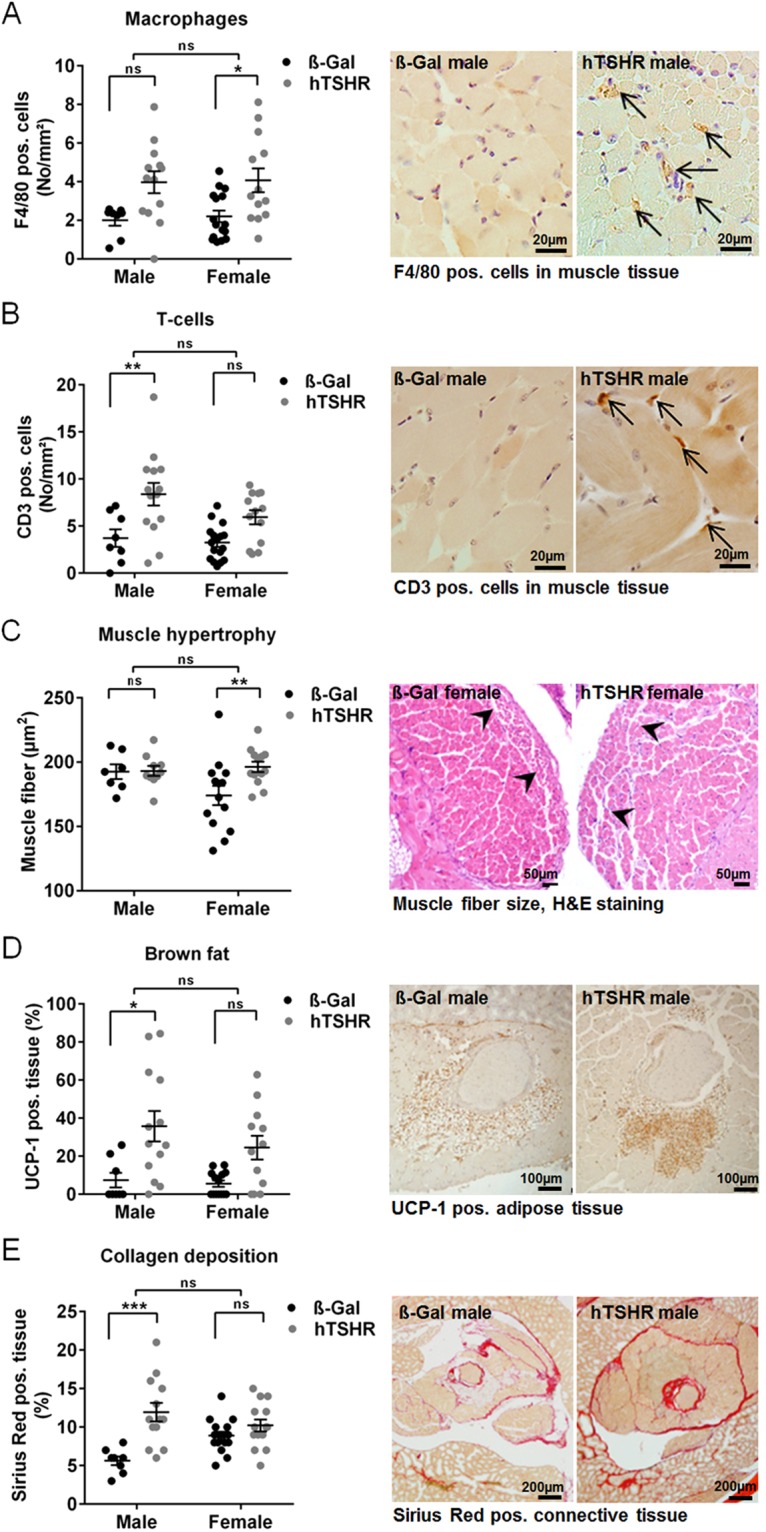
Figure 5.

Orbital tissue abnormalities in GO mouse model analyzed histologically. The orbits of mice (ß-Gal males n = 8, females n = 15; hTSHR males n = 14, females n = 14) were fixed, paraffin embedded and consecutive slices of the middle orbital area were subjected to different staining procedures. Representative pictures of stainings are shown respectively, and corresponding high-magnification images are shown in Figs S2–5. The stainings were quantitatively analyzed as described in methods. (A,B) F4/80 as a marker for macrophages, CD3 as a marker for T cells. Cells positive for F4/80 or CD3 were counted in the extraocular muscle tissue and perineural connective tissue and are given in No/mm2. Magnification x40, arrows indicate pos. stained cells. (C) H&E staining of slices. The size of muscle fibers in extraocular rectus inferior muscle and medial rectus muscle were quantified and is expressed as muscle fiber (µm2). Magnification x20. (D) UCP-1 as a marker for brown/beige fat. UCP-1 positive stained fat was quantified and is expressed as UCP-1 positive fat in % of total adipose tissue. Magnification x10. (E) Picrosirius red staining to detect collagens. Picrosirius red staining of retro orbital area (perineural connective tissue, adipose tissue and extraocular muscle tissue) was quantified and normalized to total retro orbital area (Sirius red pos. area (%). Magnnification x4. Statistical significance is indicated ***p ≤ 0.001, **p ≤ 0.01, *p ≤ 0.05, ns not significant.
