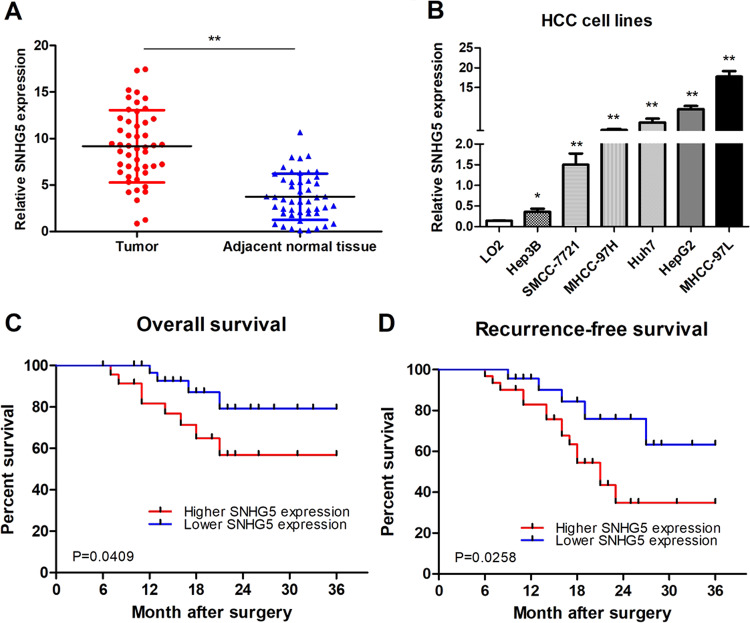
Fig. 1. SNHG5 was overexpressed in HCC tissues and hepatoma cell lines.
a qRT-PCR analysis of SNHG5 expression in 48 patients with HCC. Data were shown as the means ± s.d. *P < 0.05; **P < 0.01. b–d qRT-PCR analysis of SNHG5 expression in HCC tissues according tumor sizes (<5 cm and ≥5 cm), TNM stage (III/IV and I/II), and PVTT(Yes or No), **P < 0.01. e qRT-PCR analysis of SNHG5 expression in HCC cell lines and the immortalized human hepatic cell line LO2, *P < 0.05; **P < 0.01. f, g Kaplan–Meier analysis of OS and RFS based on SNHG5 expression levels in HCC patients. The median level of SNHG5 is used as the cutoff. Patients with HCC are divided into a high-expression group and a low-expression group

